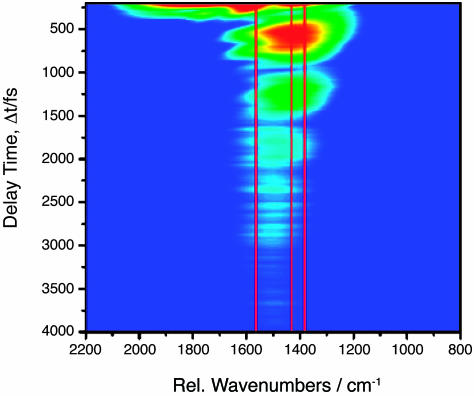
Fig. 4.
Logarithmic contour plot of the CARS signal intensity as a function of probe pulse delay Δt and as a function of the spectral shift of the CARS signal relative to the maximum in the spectrum of the probe laser pulse, obtained from a sample with 250 mM DPA in H2O/NaOH at pH 12. The positions of the Raman bands of NaDPA at 1,569, 1,435, and 1,383 cm–1 are marked with red lines in the transient spectrum.

