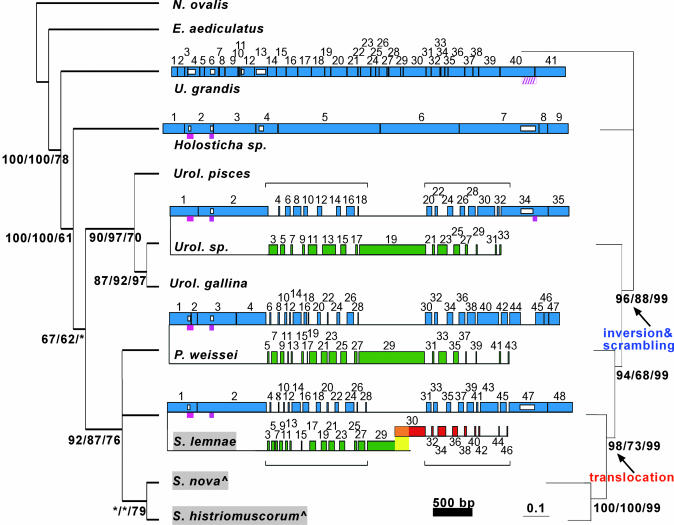
Fig. 1.
Phylogenetic analysis of the scrambled DNA pol α gene. (Left) Consensus cladogram of 19,501 most-parsimonious trees constructed with small subunit rDNA sequences for 10 spirotrichs and one heterotrich, N. ovalis. Numbers under internal branches give branch supports for maximum parsimony/minimum evolution/quartet-puzzling; branches <60% collapsed or labeled *.^, S. nova = O. nova; S. histriomuscorum = O. trifallax.(Right) Unrooted phylogram inferred from concatenated protein sequences of actin I, α-TBP, DNA pol α, and eukaryotic release factor I (eRFI). Branch supports shown for maximum parsimony/quartet-puzzling/Bayesian analyses. In the center, comparison of germ-line DNA pol α orthologs in U. grandis, Holosticha, Uroleptus, and P. weissei with S. lemnae, representing the Oxytrichidae (highlighted gray) as its sequence is the most complete; the germ-line maps for these three orthologs are very similar (4, 15, 28). Large boxes are MDSs (to scale) numbered based on somatic order; horizontal lines are IESs (not to scale); and black vertical lines indicate pointers. Confirmed introns are magenta boxes; and the putative U. grandis intron is hatched. Small white boxes represent alignment gaps ≥40 bp, for example, the absence of, or length variation in, an intron or MDS (Fig. 4). Green MDSs are upstream/inverted relative to blue MDSs; red MDSs on an unlinked locus. Horizontal brackets highlight two regions of extensive scrambling. The yellow region in S. lemnae is a 199-bp overlap between major/minor loci (4). Tables 1-4 provide MDS/IES lengths and pointer sequences.

