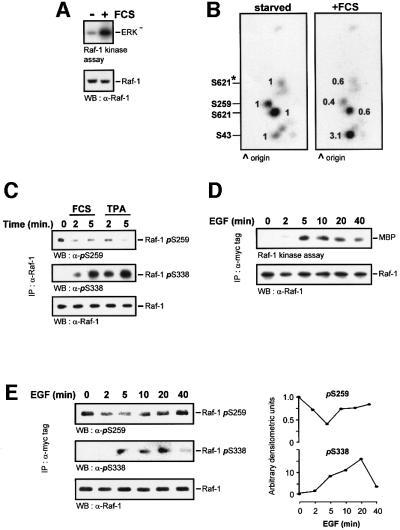
Fig. 1. Changes in Raf-1 phosphorylation during activation. Serum-starved NIH 3T3 cells were labelled with 0.5 mCi/ml [32P]ortho phosphoric acid for 6 h and stimulated with 20% FCS for 5 min. Endogenous Raf-1 was immunoprecipitated, and (A) examined for kinase activity. (B) Another Raf-1 aliquot was digested with trypsin and subjected to two-dimensional phosphopeptide mapping. Equal amounts of Raf were loaded, as evident from the western blot shown in (A). Phosphorylation sites were assigned by comparison with the respective Raf-1 point mutants. The peptide containing Ser621 produces two spots due to partial digestion; the minor spot is labelled by an asterisk. Spots were quantified by phosphoimager, and the changes relative to serum-starved cells are shown. (C) Dephosphoryl ation of endogenous Raf-1 during serum and mitogen stimulation. COS cells were treated with 10% FCS or 100 ng/ml TPA for the indicated times. Raf-1 was immunoprecipitated from the cells with an anti-Raf-1 antibody. The immunoprecipitates were then blotted with antibodies against Raf-1 and phosphoserines 259 and 338. (D) Time course of Raf-1 kinase activation. COS cells were transfected with myc-Raf, serum starved and stimulated with 20 ng/ml EGF for the indicated times. myc-Raf-1 was immunoprecipitated with the 9E10 monoclonal antibody, and catalytic activity was measured using a two-step kinase assay. (E) Myc-Raf immunoprecipitates were blotted with phospho specific antisera against phosphoserines 259 and 338. The blots were quantified by laser densitometry shown in the right hand panels.

An official website of the United States government
Here's how you know
Official websites use .gov
A
.gov website belongs to an official
government organization in the United States.
Secure .gov websites use HTTPS
A lock (
) or https:// means you've safely
connected to the .gov website. Share sensitive
information only on official, secure websites.
