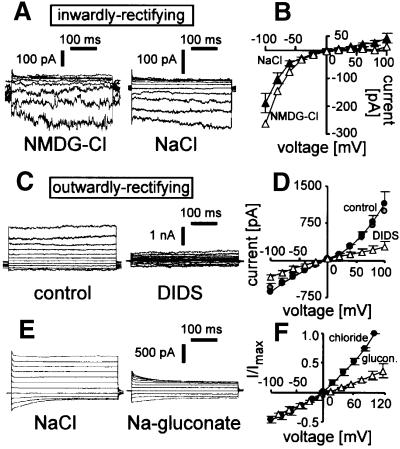
Fig. 6. Inwardly and outwardly rectifying Cl– currents in non-infected cells. (A and B) Inwardly rectifying current. Original traces (A, left) and I–V curve (B) (open symbols) of a spontaneously expressed inwardly rectifying current recorded with NMDG-Cl in the bath and pipet. In addition, in (B) (closed symbols) is the mean I–V curve of one untreated and five oxidized cells expressing inwardly rectifying currents as recorded with the standard NaCl bath and pipet solution. Original current traces of an oxidized cell recorded with NaCl in the bath and pipet are in (A) (right). (C–F) Outwardly rectifying current. Original current traces (C) and mean I–V curves (F) recorded with NaCl bath and pipet solution in oxidized cells before (C, left; and D, black circles) and during bath application of DIDS (100 µM) (C, right; and D, open triangles; n = 4). Gray circles in (D) indicate the averaged I–V curve of all oxidized cells expressing outwardly rectifying currents (n = 13) as recorded in (C) (left). (E) Original current trace of an oxidized cell with outwardly rectifying current recorded in NaCl (left) and Na-gluconate bath solution (right). (F) Mean I–V curves recorded as in (E) first in NaCl (closed circles) and then in Na-gluconate bath solution (open triangle). Shown are the normalized currents of one untreated and two oxidized cells.

An official website of the United States government
Here's how you know
Official websites use .gov
A
.gov website belongs to an official
government organization in the United States.
Secure .gov websites use HTTPS
A lock (
) or https:// means you've safely
connected to the .gov website. Share sensitive
information only on official, secure websites.
