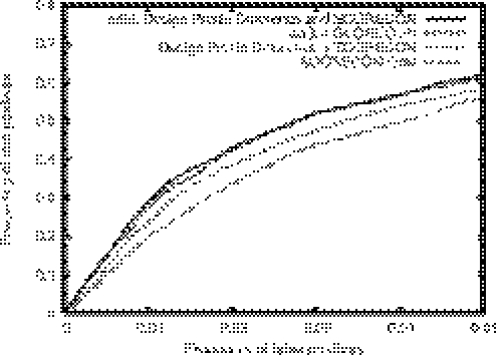
Figure 4.
ROC plots comparing functional site prediction using the sequence and energy based methods alone and in combination. The horizontal axis is the frequency of false positives (non-functional residues predicted to be functional) and the vertical axis the frequency of true positives (functional residues predicted to be functional). For the same false positive level, adding in either the natural/designed PSSM difference or the natural/optimal energy gap to the SCORECONS method increases the frequency for true positives. The combination of the three measures has the best performance.

