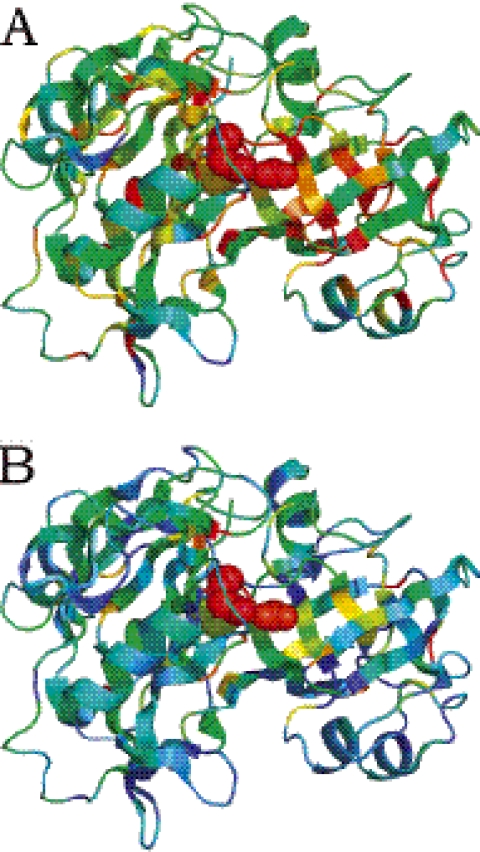
Figure 5.
Structure of chymosin B (pdb id 1 cms) colored according to sequence conservation scores (A) and combined sequence and energy based scores (B) from red (most conserved or predicted to be most functionally important) to blue (least conserved, or predicted to be least functionally important). The experimentally determined enzyme active sites are plotted in space-fill view.

