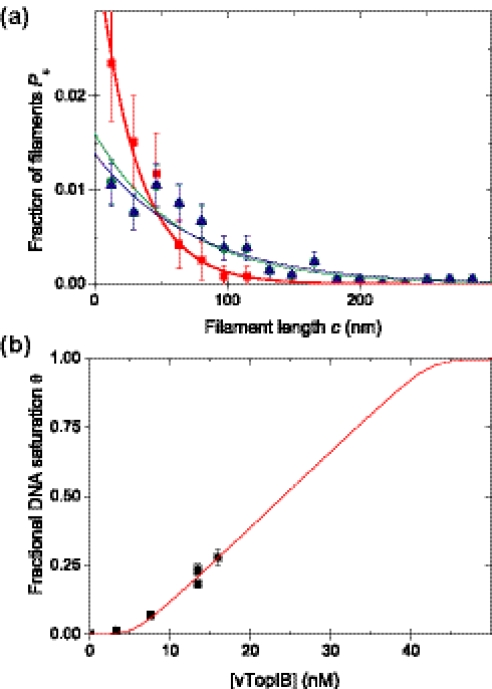
Figure 6.
Quantitative analysis of the binding of vTopIB to DNA. (a) Filament length distribution for three different data sets. For each set ω was estimated using the ML method resulting in ω = 5.6 ± 1.4 × 10³ for DNA saturation θ = 0.07 (closed squares); ω = 9.1 ± 1.7 × 10³ for DNA saturation θ = 0.18 (closed circles); and ω = 8.8 ± 1.8 × 10³ for DNA saturation θ = 0.23 (closed triangles). The solid lines in (a) are plots of Equation 1 using the obtained ω. (b) Fractional DNA saturation as a function of total vTopIB concentration. The fit of Equation 4 to these data using n = 18, N = 2743 and ω = 7.7 ± 1.1 × 10³ yielded a value for K* = 4.0 ± 0.4 × 10⁴ M−1.

