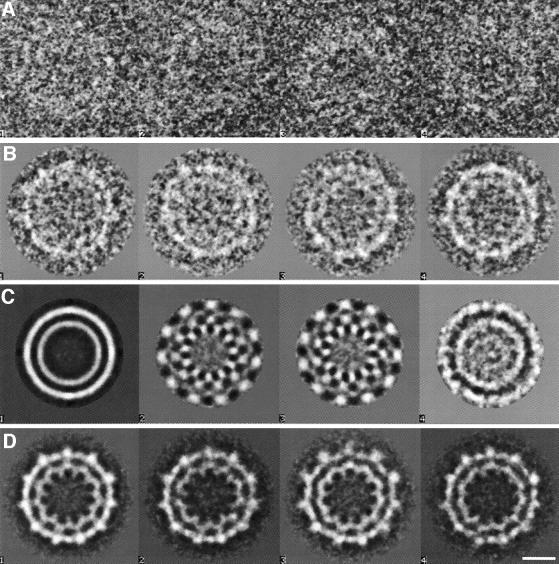
Fig. 5. Symmetry analysis of 898 top views of the dynamin A* ring complex. (A) Four original images from the data set as picked from the digitized micrograph are shown. (B) Four of the 90 classes obtained after multivariate statistical analysis classification of the centred top views are shown. The two concentric rings and their 11-fold symmetry become noticeable. (C) The first four eigenimages of the analysis are shown. The first one resembles the total average of the data set (van Heel, 1989), the two subsequent eigenimages (identical symmetric wave patterns 90° out of phase) illustrate the most important difference between the individual images, that is a rotational misalignment of an 11-fold symmetric component. No further symmetry is obvious from the following eigenimages, indicating a uniform composition of the ring complexes. (D) The four final classes of aligned images are shown. The lack of significant differences allows all images to be superimposed (see Figure 6A). Same scale in (A)–(D); the scale bar represents 10 nm.

An official website of the United States government
Here's how you know
Official websites use .gov
A
.gov website belongs to an official
government organization in the United States.
Secure .gov websites use HTTPS
A lock (
) or https:// means you've safely
connected to the .gov website. Share sensitive
information only on official, secure websites.
