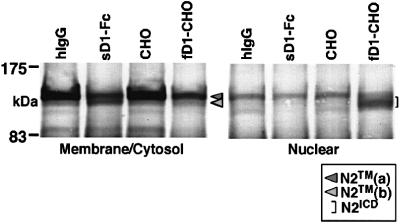
Fig. 2. N2 molecule traced after sD1–Fc and fD1 stimulations. BaF3 was stimulated for 1.5 h under the conditions indicated in the figure and then separated into membrane/cytosol-rich and nucleus-rich fractions. In each fraction, N2 fragments containing an ICD were analyzed by western blot analysis using the bhN6 antibody after immunoprecipitation with an anti-N2 polyclonal antibody.

An official website of the United States government
Here's how you know
Official websites use .gov
A
.gov website belongs to an official
government organization in the United States.
Secure .gov websites use HTTPS
A lock (
) or https:// means you've safely
connected to the .gov website. Share sensitive
information only on official, secure websites.
