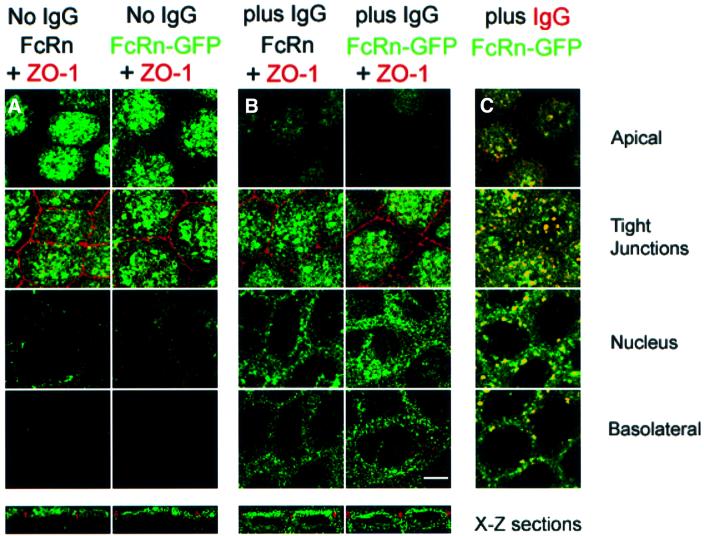
Fig. 2. Confocal images of FcRn and FcRn–GFP distributions in serum-starved cells in the presence or absence of ligand. Bar, 5 µm. Sections labeled as apical, tight junctions, nucleus and basolateral are X–Y planes that were taken 1, 3, 6 and 9 µm, respectively, from the apical surface of the monolayer. Bottom panels show X–Z views of the cell monolayer. FcRn–GFP was detected using fluorescence from GFP, and FcRn was detected using a labeled secondary antibody bound to an anti-rat FcRn monoclonal antibody (see Materials and methods). The similarity in the distributions of FcRn and FcRn–GFP indicates that addition of GFP to the cytoplasmic tail of FcRn did not disrupt localization and trafficking signals contained within the protein. (A) FcRn and FcRn–GFP distributions in the absence of ligand. (B) FcRn and FcRn–GFP distributions 60 min after adding 1 µM rat IgG at pH 7.3 to the apical side of the cell monolayer at 37°C. (C) Superposition of fluorescence from FcRn–GFP and IgG 60 min after adding 5 µM Alexa568-labeled rat IgG at pH 7.3 to the apical side of the cell monolayer. Regions of co-localization appear yellow. Although there is no detectable IgG fluorescence that does not co-localize with FcRn–GFP, much of the FcRn–GFP fluorescence that redistributes to the perinuclear and basolateral levels as a result of IgG addition does not co-localize with IgG, which may result from FcRn molecules bound to unlabeled IgG proteins present in the labeled IgG sample. Alternatively, IgG binding to FcRn may signal in trans to ligand-free FcRn.

An official website of the United States government
Here's how you know
Official websites use .gov
A
.gov website belongs to an official
government organization in the United States.
Secure .gov websites use HTTPS
A lock (
) or https:// means you've safely
connected to the .gov website. Share sensitive
information only on official, secure websites.
