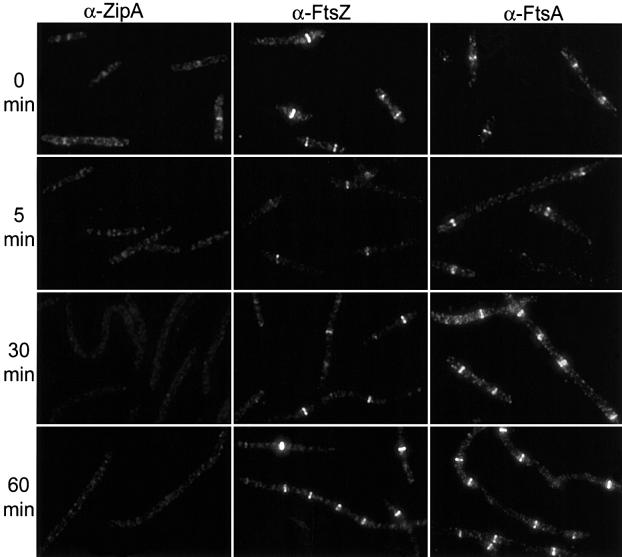
Fig. 2. Localization of ZipA, FtsZ and FtsA in zipA1 (Ts) cells. PS223 [zipA1 (Ts)] was grown as in Figure 1. Samples were taken, fixed and processed for fluorescence microscopy as described in Materials and methods. The first, second and third columns are photographs of cells stained with anti-ZipA, anti-FtsZ and anti-FtsA antisera as indicated. Samples were taken at various times after the temperature shift to 42°C as indicated to the left of the figure.

An official website of the United States government
Here's how you know
Official websites use .gov
A
.gov website belongs to an official
government organization in the United States.
Secure .gov websites use HTTPS
A lock (
) or https:// means you've safely
connected to the .gov website. Share sensitive
information only on official, secure websites.
