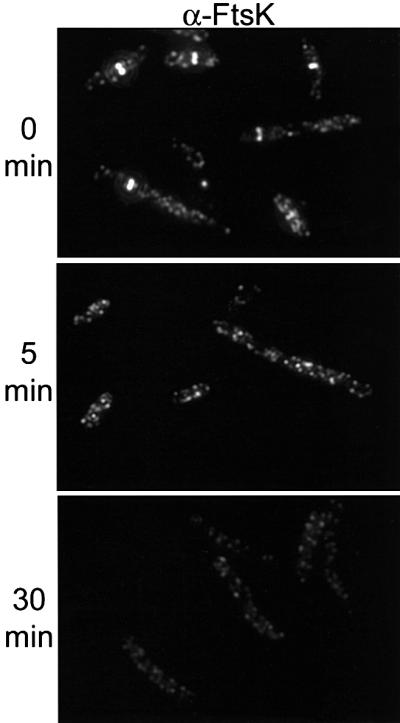
Fig. 3. Localization of FtsK in zipA1 (Ts) cells. PS223 [zipA1 (Ts)] was grown as in Figure 1. Samples were taken at 30°C and after a shift to 42°C, fixed and processed for fluorescence microscopy as described in Materials and methods. The upper panel shows cells before the temperature shift. The middle and lower panels show cells at 5 and 30 min, respectively, after the temperature shift to 42°C.
