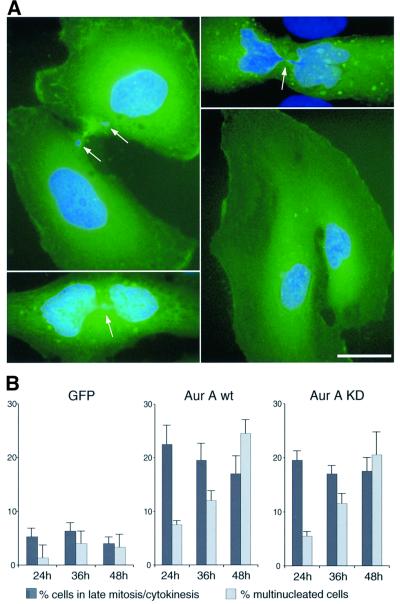
Fig. 4. Cytokinesis failure in cells overexpressing Aurora-A. (A) HeLa cells were transfected with wt or KD mutant EGFP–Aurora A and analyzed by immunofluorescence microscopy. Transfected cells were identified by GFP fluorescence (green) and DNA was stained with DAPI (blue). Arrows indicate lagging chromosomes and inter connecting DNA bridges. Scale bar: 10 µm. (B) Histogram illustrating the effects of Aurora-A overexpression on the proportion of cells in late mitosis/cytokinesis (dark gray bars) and the frequency of multinucleated cells (light gray bars). Transfected cells were classified at the time points indicated. Results were averaged from three independent experiments (300–600 cells each) and bars indicate standard deviations.

An official website of the United States government
Here's how you know
Official websites use .gov
A
.gov website belongs to an official
government organization in the United States.
Secure .gov websites use HTTPS
A lock (
) or https:// means you've safely
connected to the .gov website. Share sensitive
information only on official, secure websites.
