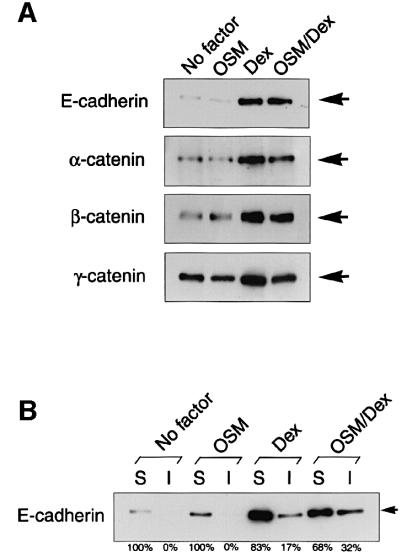
Fig. 3. Expression of AJ components and subcellular localization of E-cadherin. Fetal hepatocytes were cultured for 6 days with stimulation as indicated in the figure. (A) Total protein levels of AJ components in fetal hepatocytes. Cell extracts from each culture were analyzed by western blotting using antibodies against E-cadherin, and α-, β- and γ-catenins. The location of each protein is indicated by an arrow. (B) Detergent solubility assay in cultured hepatocytes. Cell extracts were fractionated into soluble (S) and insoluble (I) fractions as described in Materials and methods. E-cadherin protein levels in each fraction were determined by western blotting using anti-E-cadherin antibody. The abundance of E-cadherin in each fraction was estimated by quantitative analysis using the NIH image program, and the ratios of [S] or [I] in [S + I] at each culture condition are shown.

An official website of the United States government
Here's how you know
Official websites use .gov
A
.gov website belongs to an official
government organization in the United States.
Secure .gov websites use HTTPS
A lock (
) or https:// means you've safely
connected to the .gov website. Share sensitive
information only on official, secure websites.
