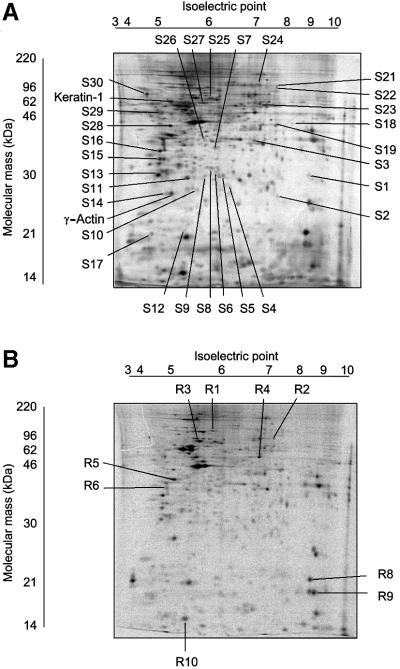
Fig. 1. Two-dimensional electrophoresis gels, with annotations of spots of identified proteins. Images of a silver-stained gel (A) and a gel with [35S]methionine-labelled proteins (B), obtained from cells not treated with TGFβ1, are shown. Spots containing proteins that increased or decreased in amount in response to treatment of cells by TGFβ1 (5 ng/ml) and that were identified by PMF, are shown; S1–S30 represent annotated spots, identified by analysis of silver-stained gels, and R1–R10 represent annotated [35S]methionine-labelled spots. The pH gradient of the first-dimension electrophoresis is shown on top of the gels, and migration of molecular mass markers for SDS–PAGE in the second dimension is shown on the side of the gel. Migration positions for keratin-1 and γ-actin, used as internal landmarks, are shown.

An official website of the United States government
Here's how you know
Official websites use .gov
A
.gov website belongs to an official
government organization in the United States.
Secure .gov websites use HTTPS
A lock (
) or https:// means you've safely
connected to the .gov website. Share sensitive
information only on official, secure websites.
