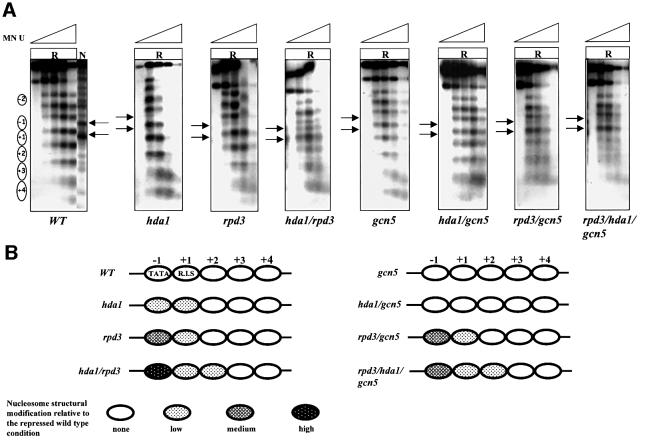
Fig. 3. Effects of histone acetylation on ADH2 chromatin structure. (A) MN analysis of the ADH2 promoter region in repressing conditions (R, 3% glucose). Nystatin-permeabilized spheroplasts were reacted with increasing amounts of MN (U = units/0.25 ml: 0, 0.57, 1.7, 5 and 15), deproteinized, digested with BamHI and HindIII (map positions are –1202 and +760, respectively), and analyzed by indirect end-labeling. Nucleosomes (i.e. protected areas) are represented as ovals. Lane N (naked control) contains deproteinized DNA from plasmid pFA treated in vitro with MN and the same restriction enzymes as the in vivo samples. (B) Summary of nucleosome structural modifications. The chromatin changes, relative to the wild-type YDS2 strain, are summarized; the different shadings indicate the intensity of the changes (none, low, medium and high).

An official website of the United States government
Here's how you know
Official websites use .gov
A
.gov website belongs to an official
government organization in the United States.
Secure .gov websites use HTTPS
A lock (
) or https:// means you've safely
connected to the .gov website. Share sensitive
information only on official, secure websites.
