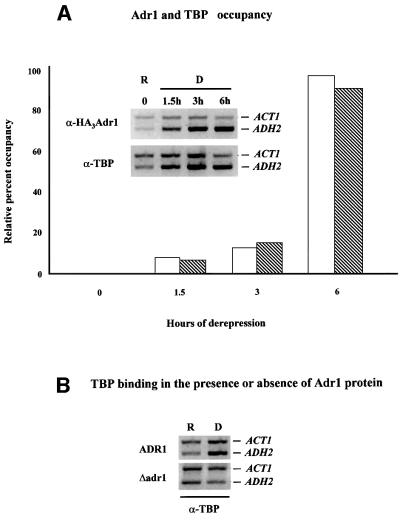
Fig. 4. Adr1 and TBP occupancy of the ADH2 promoter. (A) ChIP assays for Adr1-HA and TBP were performed with anti-HA and anti-yTBP, respectively, as described in Materials and methods. The primer pairs for the PCR analysis, followed by gel electrophoresis (inset), are located at –432 and –139 from the ADH2 ATG. The primer pairs for the ACT1 control were located at +418 and +797 in the ACT1 ORF. Real-time PCR analysis was carried out with an Applied Biosystems Model 700 and software as described by the manufacturer. The primer pairs for the real-time PCR analysis are located at –283 and –187 from the ADH2 ATG. The primer pairs for the ACT1 control were located at +448 and +531 in the ACT1 ORF. The real-time PCR data are shown in the graph and are plotted as a percent of the ADH2 product generated using ChIP DNA isolated from repressed cells, after correcting for the amount of ACT1 DNA in each sample (white and hatched bars refer to Adr1 and TBP occupancy, respectively). R, repressed conditions (3% glucose); D, derepressed conditions (0.05% glucose). (B) ChIP assays for TBP occupancy in wild-type and adr1 strains. PCR and electrophoretic analysis were carried out as described in Materials and methods and in (A).

An official website of the United States government
Here's how you know
Official websites use .gov
A
.gov website belongs to an official
government organization in the United States.
Secure .gov websites use HTTPS
A lock (
) or https:// means you've safely
connected to the .gov website. Share sensitive
information only on official, secure websites.
