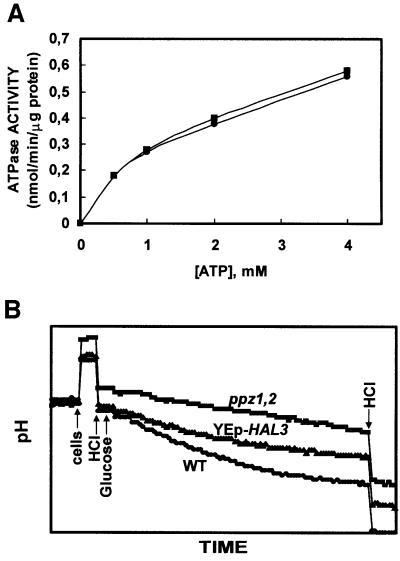
Fig. 5. Analysis of Pma1p activity in vitro and in vivo. (A) ATPase activity of plasma membranes purifed from glucose-fed cells was assayed at pH 6.5. DBY746 (squares), and DBY746 ppz1::URA3 ppz2::TRP1 (circles). Each reaction contained 2 µg of protein and the samples were incubated at 28°C for 60 min. Each data point represents the average of two independently isolated membrane preparations each assayed in duplicate. Standard deviations were <5%. (B) The strains indicated (DBY746 [pRS699], DBY746 [pRS699-HAL3] and DBY746 ppz1::URA3 ppz2::TRP1) were grown to mid-log phase, harvested, washed and resuspended in sterile water and incubated for 3 h at 28°C. Cells (30 mg) were then suspended in 10 ml of assay buffer and pH changes were recorded after the addition of 200 µmol of glucose. Cells, glucose and HCl (400 nmol for calibration) were added where indicated. Similar results were observed in two separate experiments and after overnight starvation at 4°C.

An official website of the United States government
Here's how you know
Official websites use .gov
A
.gov website belongs to an official
government organization in the United States.
Secure .gov websites use HTTPS
A lock (
) or https:// means you've safely
connected to the .gov website. Share sensitive
information only on official, secure websites.
