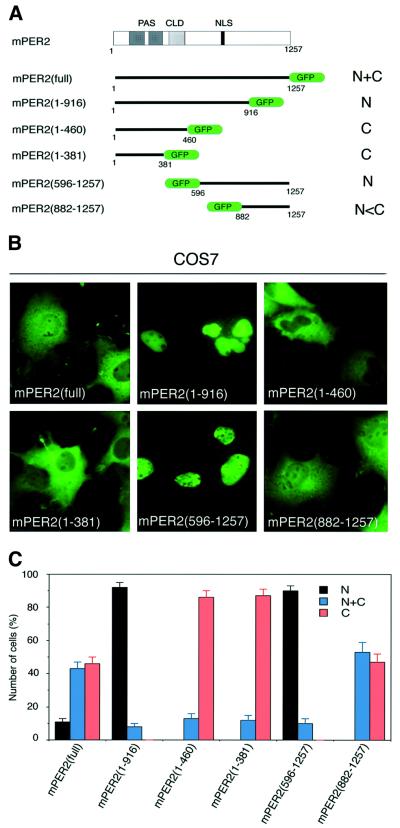
Fig. 1. Different domains of mPER2 influence its subcellular localization. Full-length and truncated GFP-tagged mPER2 proteins were transiently expressed in COS7 cells and analyzed for the subcellular distribution pattern of mPER2 proteins. (A) Schematic diagram of the mPER2 protein, including the position of PAS, CLD and NLS sequences and the six constructs. (B) Representative examples of the subcellular distribution patterns of the various mPER2 proteins, as detected by GFP fluorescence. (C) Percentage of cells showing nuclear (N, black bars), nuclear–cytoplasmic (N+C, blue bars) and cytoplasmic (C, red bars) staining. Three independent experiments were performed in which 100–200 mPER2–GFP-expressing cells were counted. Error bars indicate the SEM.

An official website of the United States government
Here's how you know
Official websites use .gov
A
.gov website belongs to an official
government organization in the United States.
Secure .gov websites use HTTPS
A lock (
) or https:// means you've safely
connected to the .gov website. Share sensitive
information only on official, secure websites.
