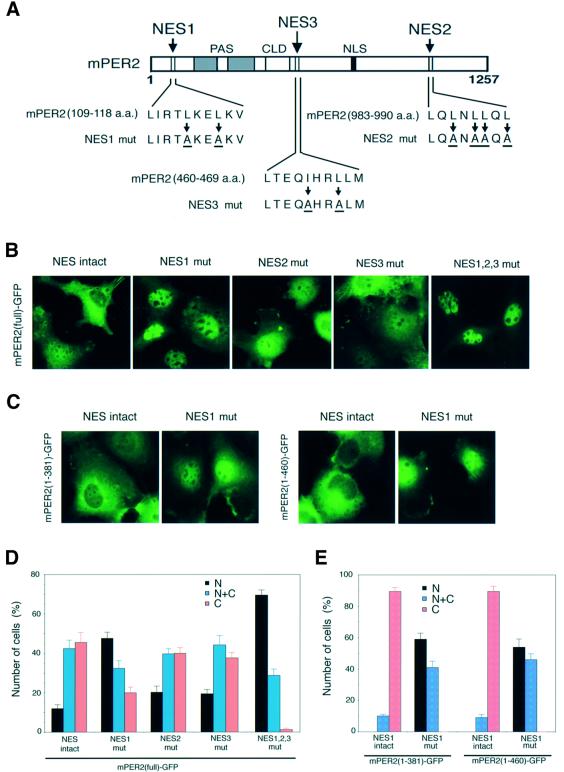
Fig. 3. NES domains control cytoplasmic distribution of mPER2 in cultured mammalian cells. Subcellular localization of full-length and truncated mPER2–GFP with wild-type and mutant NES domains in transiently transfected COS7 cells. (A) Schematic representation of the three NES domains in mPER2 and the substituted critical hydrophobic amino acids in the mutant NES domains (referred to as NES1 mut, NES2 mut and NES3 mut). (B) Representative examples of the subcellular distribution patterns of mPER2(full)–GFP with intact or mutant NES domains. (C) As (B), except that mPER2(1–381)–GFP and mPER2(1–460)–GFP with an intact or mutant NES1 were used. (D and E) Quantitative analysis of the percentage of cells expressing nuclear (N, black bars), nuclear–cytoplasmic (N+C, blue bars) and cytoplasmic (C, red bars) mPER2–GFP for the experiment shown in (B) and (C), respectively. Data were obtained from three independent experiments and in each experiment 100–200-expressing cells were evaluated. Error bars indicate the SEM.

An official website of the United States government
Here's how you know
Official websites use .gov
A
.gov website belongs to an official
government organization in the United States.
Secure .gov websites use HTTPS
A lock (
) or https:// means you've safely
connected to the .gov website. Share sensitive
information only on official, secure websites.
