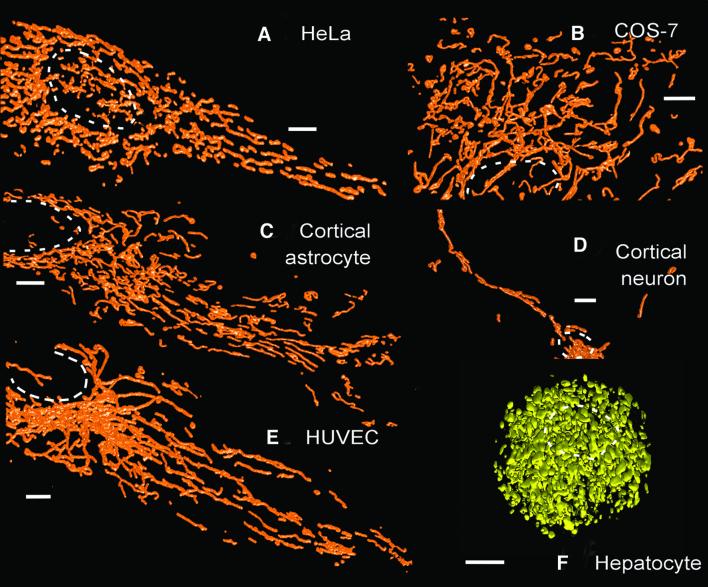
Fig. 1. Surface-rendered three-dimensional reconstructions of cells expressing mito-DsRed1. (A–E) Typical three-dimensional reconstructions of mito-DsRed1 fluorescence in the following cell types: (A) HeLa, (B) COS-7, (C) cortical astrocyte, (D) cortical neuron and (E) HUVEC. (F) A reconstruction of mitochondrial calcein fluorescence in a hepatocyte. The dashed circles indicate the position of nuclei. Scale bars, 5 µm.

An official website of the United States government
Here's how you know
Official websites use .gov
A
.gov website belongs to an official
government organization in the United States.
Secure .gov websites use HTTPS
A lock (
) or https:// means you've safely
connected to the .gov website. Share sensitive
information only on official, secure websites.
