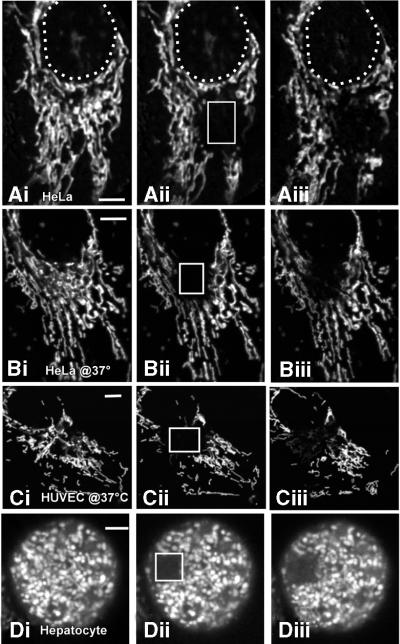
Fig. 2. Assessment of lumenal continuity between mitochondria using FRAP. A HeLa cell (Ai–iii and Bi–iii) and a HUVEC cell (Ci–iii) expressing mito-DsRed1, and a primary hepatocyte loaded with calcein (Di–iii) were imaged before (Ai–Di), ∼10 s after (Aii–Dii) and 20 min after (Aiii–Diii) photobleaching a subcellular region of each cell type. The white boxes in (Aii–Dii) denote the bleached regions in each cell. The experiments depicted in (A) and (D) were performed at 22°C, and those in (B) and (C) were at 37°C. Scale bars, 5 µm. The results shown in this figure are typical of every trial (n >5) for each cell type and temperature.

An official website of the United States government
Here's how you know
Official websites use .gov
A
.gov website belongs to an official
government organization in the United States.
Secure .gov websites use HTTPS
A lock (
) or https:// means you've safely
connected to the .gov website. Share sensitive
information only on official, secure websites.
