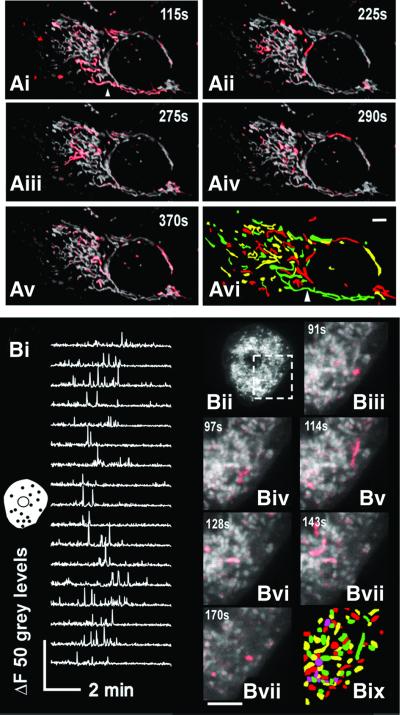
Fig. 4. Induced depolarization events reveal multiple, electrically discrete mitochondria. (Ai–v) A TMRE-loaded HeLa cell showing random depolarization of discrete mitochondria. The depolarization events were assessed using a frame-by-frame subtraction. This generated a series of images in which the positions of depolarized mitochondria appear from a dark background. These events were pseudocoloured red and superimposed on the original image of the mitochondria as shown. The experiment was actually recorded for 10 min, but only representative frames are shown. The times at which the images were captured relative to the start of the recording are shown. (Avi) Map of individual electrically isolated mitochondria. This was constructed by monitoring the locations of individual depolarization events over time. The red, green and yellow colouration is used to indicate the locations of the electrically isolated mitochondria. The colours do not indicate any relationships between mitochondria. The arrowhead in (Avi) indicates a single 45 µm mitochondria seen to depolarize in (Ai). Scale bar, 5 µm. (B) Depolarizations of mitochondria within a TMRE-loaded primary hepatocyte imaged at 2 Hz. (Bi) The change in fluorescence of individual mitochondria (the locations at which the mitochondrial fluorescence was monitored are depicted by black dots in the inset cell image) plotted over 8 min of laser irradiation. Note that depolarization events only start after a significant period of imaging (∼90 s), confirming that the PTP ‘flickering’ is a laser- and dye-induced phenomenon. (Bii) De piction of the image of the TMRE-loaded cell. The region bounded by the dashed box is shown on an expanded scale in (Biii–viii), and the depolarization events are superimposed with red colouration. (Bix) Map of individual electrically isolated mitochondria constructed by monitoring the locations of individual depolarization events over time. The red, green, cyan and yellow colouration is used to indicate the locations of the electrically isolated mitochondria, and does not indicate any relationships between mitochondria. Scale bar, 5 µm.

An official website of the United States government
Here's how you know
Official websites use .gov
A
.gov website belongs to an official
government organization in the United States.
Secure .gov websites use HTTPS
A lock (
) or https:// means you've safely
connected to the .gov website. Share sensitive
information only on official, secure websites.
