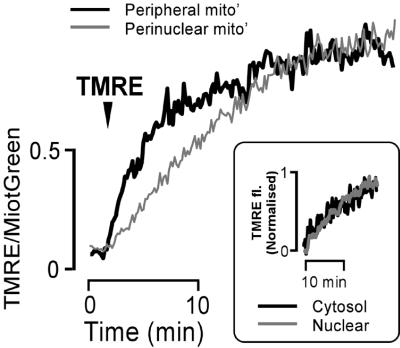
Fig. 6. Heterogeneity in Δψmit reported by TMRE. The figure illustrates TMRE loading of peripheral (thick black line) and perinuclear (thin grey line) mitochondria pre-loaded with Mitotracker Green FM (1 µM, 25 min). The arrowhead indicates addition of TMRE (0.1 µM). TMRE loading is expressed as a ratio of TMRE fluorescence:Mitotracker Green FM fluorescence. The data in this figure were obtained by monitoring TMRE sequestration in six cells. For each of these cells, TMRE uptake was analysed in 10 randomly chosen perinuclear and peripheral mitochondria. The graph therefore represents the averaged response of 60 mitochondria for both the peripheral and perinuclear traces. The inset image shows the increase in TMRE fluorescence in the nucleus and peripheral cytoplasm.

An official website of the United States government
Here's how you know
Official websites use .gov
A
.gov website belongs to an official
government organization in the United States.
Secure .gov websites use HTTPS
A lock (
) or https:// means you've safely
connected to the .gov website. Share sensitive
information only on official, secure websites.
