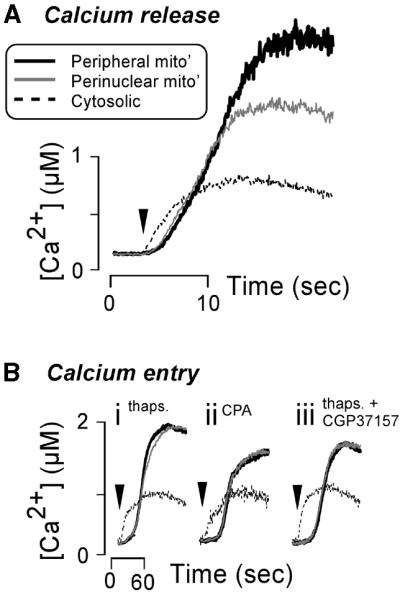
Fig. 7. Perinuclear and peripheral mitochondria sequester agonist- induced Ca2+ signals to different extents. (A) HeLa cells loaded with rhod-2 were treated with 100 µM histamine (arrowhead) to trigger Ca2+ release from the ER. The resultant cytosolic Ca2+ change [thin dashed line in (A)] was monitored by recording rhod-2 fluorescence in the nucleus as described previously (Collins et al., 2001). In addition, Ca2+ increases in the perinuclear mitochondria (thin grey line) and peripheral mitochondria (thick black line) were followed. (B) Depiction of the similarity of Ca2+ sequestration by perinuclear and peripheral mitochondria during Ca2+ entry. Prior to the traces shown in (Bi–iii), the ER Ca2+ pool was depleted by pre-treatment of cells with 2 µM thapsigargin in 4 mM EGTA or 50 µM CPA in 4 mM EGTA. Ca2+ entry was initiated by substituting the EGTA in the extracellular medium with 1.8 mM CaCl2 (arrowheads). The sodium/Ca2+ exchanger was inhibited for the response shown in (Biii) by the addition of 10 µM CGP37157 for 5 min before the replacement of EGTA with CaCl2. For the responses in (A), where the histamine-stimulated Ca2+ signals were rapid, the cells were imaged at 15 Hz. The slower Ca2+ entry signals in (B) were imaged at 0.5 Hz. Traces represent the mean of 10 cells, with >10 individual mitochondria or small clusters of mitochondria being analysed in each cell.
