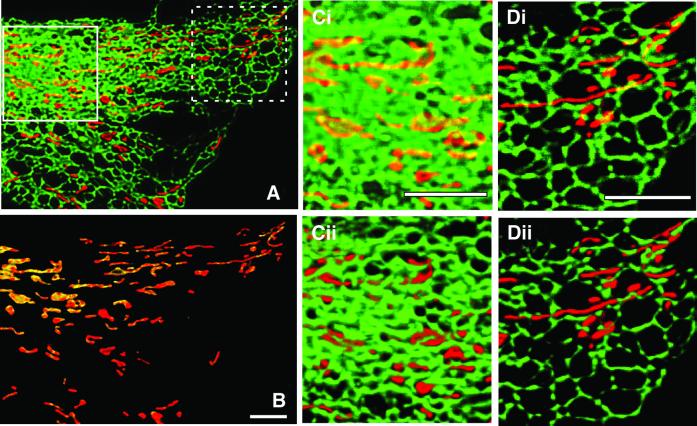
Fig. 8. Association between ER and mitochondria in the periphery and perinuclear regions of a cell. (A) Maximum z-projection of a HeLa cell expressing ER-targeted EGFP (shown as green) and mito-DsRed1 (shown as red). The nucleus is out of view to the left of the image. (B) Yellow regions denote where ER and mitochondria co-localize within the resolution of the deconvolved, confocal image. The regions bounded by white boxes in (A) are shown on expanded scales in (Ci) (perinuclear region) and (Di) (peripheral region). The same expanded regions are shown as surface-rendered versions in (Cii) and (Dii), respectively, to show that the perinuclear mitochondria are embedded in ER, whilst the peripheral mitochondria are more remote from the ER. The images are presented as if the cell is viewed from above. The view from underneath the cell shows a similar pattern. Scale bars, 5 µm.

An official website of the United States government
Here's how you know
Official websites use .gov
A
.gov website belongs to an official
government organization in the United States.
Secure .gov websites use HTTPS
A lock (
) or https:// means you've safely
connected to the .gov website. Share sensitive
information only on official, secure websites.
