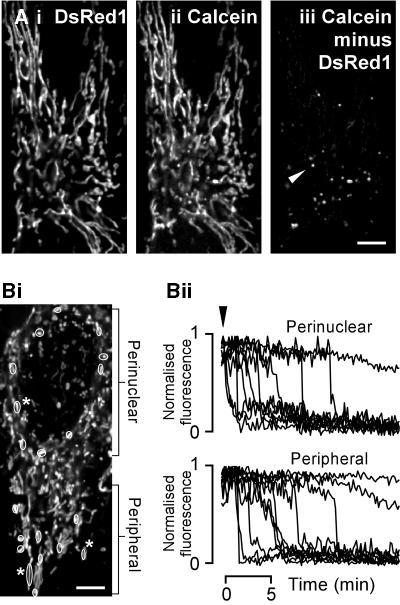
Fig. 9. Asynchronous PTP activation within a single cell. Location of mito-DsRed1 (Ai) and calcein (Aii) fluorescence in the same cell. (Aiii) Difference image [i.e. (Aii) subtracted from (Ai)], indicating that mito-DsRed1 and calcein co-localized to the same organelles, except in a few small spherical vesicles [e.g. spot marked by arrowhead in panel (Aiii)]. (Bi) Another single calcein-loaded HeLa cell. The circled mitochondria in (Bi) indicate the locations of organelles from which the fluorescence in (Bii) was recorded. PTP activation was initiated by addition of 100 µM tBuOOH [arrowhead in (Bii)]. The drop in fluorescence indicates PTP opening. The traces are expressed as normalized fluorescence calculated as (F – Fmin)/(Fmax – Fmin), except for those mitochondria that did not undergo PTP, which are expressed as F/Fmax (i.e. where there was no Fmin). The numbered mitochondria in (Bi) are those that did not show PTP activation during the experiment. The fluorescence of calcein in these mitochondria is depicted by the correspondingly numbered traces in (Bii). Scale bar, 5 µm.

An official website of the United States government
Here's how you know
Official websites use .gov
A
.gov website belongs to an official
government organization in the United States.
Secure .gov websites use HTTPS
A lock (
) or https:// means you've safely
connected to the .gov website. Share sensitive
information only on official, secure websites.
