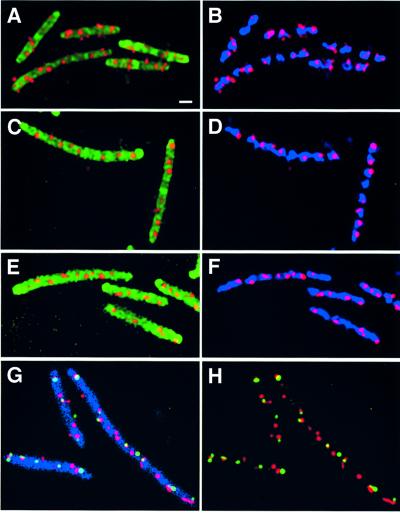
Fig. 3. Fluorescence micrographs of FISH experiments showing plasmid localization in cells grown in LB at 30°C and treated with cephalexin two generations prior to collecting samples for microscopy. The outlines of the filaments were visualized by staining the cell membranes with MTG and appear green in (A), (C) and (E) and blue in (G). The nucleoids were stained with DAPI and appear blue in (B), (D) and (F). (A and B) RK2 plasmids form regularly spaced foci (red) along the length of the filaments of strain JP704. (C and D) P1 plasmids form foci (red) regularly distributed along the entire length of the filaments of strain JP857. (E and F) F plasmids form foci (red) along the entire length of the filaments of strain JP911. (G and H) Dual labeling of F (red) and P1 (green) in cephalexin-induced filaments of JP821. (G) F plasmids (red) and P1 plasmids (green) form foci that are regularly spaced along the length of the filaments (blue). (H) F and P1 alone (no membranes) showing that most of the foci do not overlap. Bar in (A) = 1 µm. All panels are at the same scale.

An official website of the United States government
Here's how you know
Official websites use .gov
A
.gov website belongs to an official
government organization in the United States.
Secure .gov websites use HTTPS
A lock (
) or https:// means you've safely
connected to the .gov website. Share sensitive
information only on official, secure websites.
