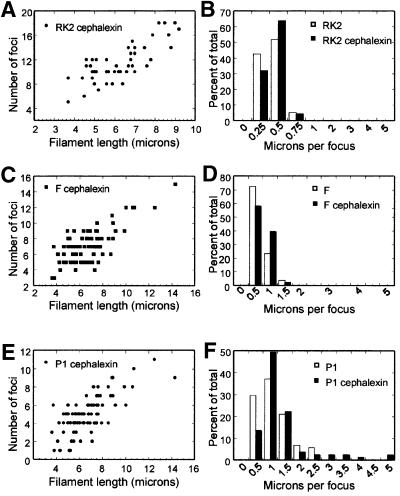
Fig. 4. Segregation of F, P1 and RK2 in the presence of the cell division inhibitor cephalexin. (A) The number of RK2 foci per cell increases with cell length in filaments of strain JP704 formed by treatment with cephalexin in LB at 30°C. (B) The number of RK2 foci per cell was normalized to cell length (microns per focus) and plotted versus the percentage of total cells. Strain JP704 was grown in LB at 30°C in the absence (white bars) or presence (black bars) of cephalexin. For (A) and (B), a total of 59 wild-type cells containing 148 foci and 47 filaments containing 540 foci were measured. (C–F) The effect of cephalexin on F and P1 distribution in filaments of strain JP821 grown in LB at 30°C. A total of 108 wild-type (untreated) cells containing 191 P1 and 287 F foci were measured. A total of 81 cephalexin-treated cells (filaments) containing 408 P1 and 583 F foci were measured. (C) The number of F foci per cell increases with cell length in cephalexin-induced filaments of JP821. The number of foci per filament is plotted versus filament length. (D) The number of F foci per cell was normalized to cell length (microns per focus) and plotted versus the percentage of total cells. Untreated cells (white bars) have approximately the same number of microns per focus as cephalexin-treated cells (black bars). (E) The number of P1 foci per cell increases with cell length in cephalexin-induced filaments of JP821. The number of foci per filament is plotted versus filament length. (F) The number of P1 foci per cell was normalized to cell length (microns per focus) and plotted versus the percentage of total cells. Untreated cells (white bars) range from 0.5 to 2.5 µm per focus, whereas a small percentage of cephalexin-treated cells (black bars) range up to 5 µm per focus.

An official website of the United States government
Here's how you know
Official websites use .gov
A
.gov website belongs to an official
government organization in the United States.
Secure .gov websites use HTTPS
A lock (
) or https:// means you've safely
connected to the .gov website. Share sensitive
information only on official, secure websites.
