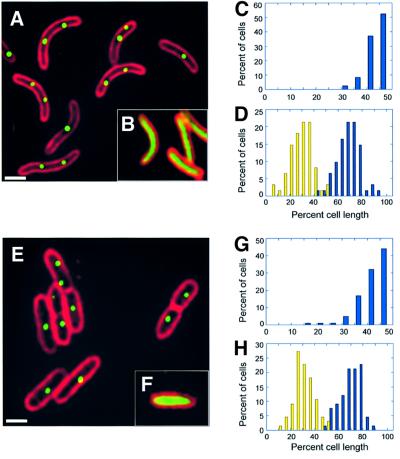
Fig. 6. Localization of GFP-tagged RK2 in Vibrio cholerae (A–D) and Pseudomonas. aeruginosa (E–H). Fluorescence micrographs showing a field of V.cholerae (A) or P.aeruginosa (E) in which the cell membranes were stained red with FM 4-64, and GFP–LacI was expressed from plasmid pZZ15 by induction with 0.2% l-arabinose as described in Materials and methods. Cells containing the control plasmid pZZ16 are shown in (B) and (F). White bars = 1 µm. Subcellular distribution of RK2 in V.cholerae for cells (n = 144) containing one focus (C) or two foci (D) and in P.aeruginosa for cells (n = 191) containing one focus (G) or two foci (H). the positions of GFP foci were measured with respect to one end of the cell (reported as a percentage of cell length) and plotted versus the percentage of total cells.

An official website of the United States government
Here's how you know
Official websites use .gov
A
.gov website belongs to an official
government organization in the United States.
Secure .gov websites use HTTPS
A lock (
) or https:// means you've safely
connected to the .gov website. Share sensitive
information only on official, secure websites.
