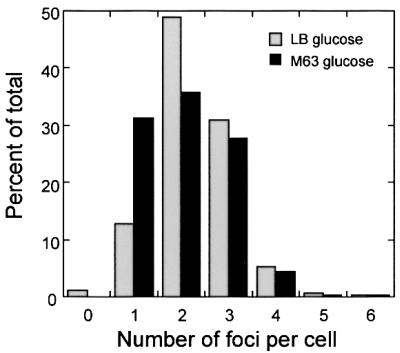
Fig. 7. Histogram showing the number of GFP-tagged RK2 foci per cell in V.cholerae strain JP909 in different growth conditions. The percentage of total cells is plotted versus the number of foci per cell during growth in M63 glucose at 30°C (black bars, 470 total cells) and LB glucose at 30°C (gray bars, 374 total cells).
