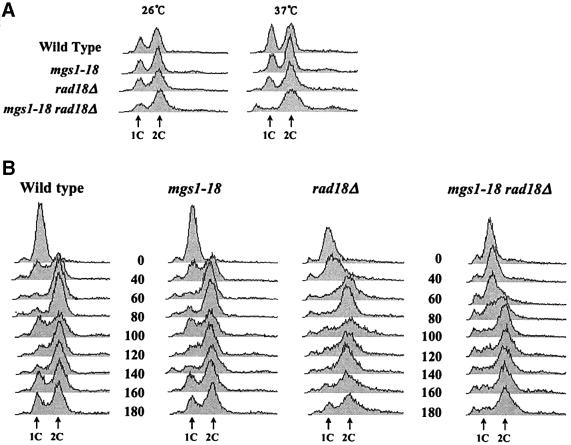
Fig. 4. FACS analysis of mgs1-18 rad18Δ cells. (A) FACS analysis of the DNA content of asynchronized cells. Cells were incubated to early log phase and then shifted to 37°C for 6 h. (B) FACS analysis of the DNA content of synchronized cells. Cells were synchronized at G1 by treatment with α-factor at 26°C and then released at 37°C. Aliquots were taken at the indicated time points. DNA content was measured by FACS.

An official website of the United States government
Here's how you know
Official websites use .gov
A
.gov website belongs to an official
government organization in the United States.
Secure .gov websites use HTTPS
A lock (
) or https:// means you've safely
connected to the .gov website. Share sensitive
information only on official, secure websites.
