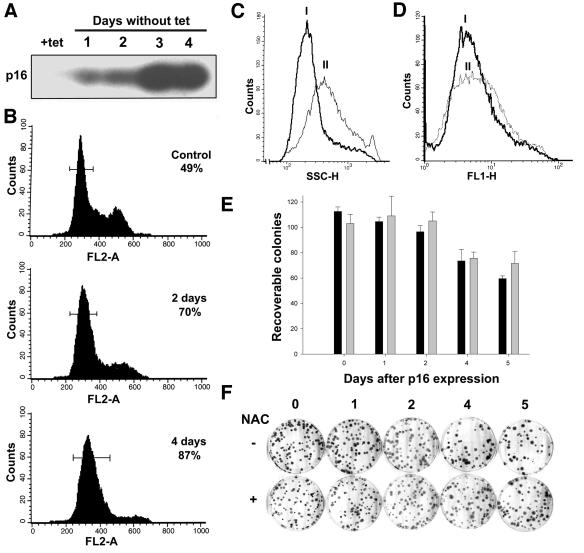
Fig. 4. Effects of p16 induction on the growth arrest/senescent phenotype of EJp16 cells. (A) EJp16 cell lysates obtained at varying time periods following tet removal were subjected to immunoblot analysis with anti-p16 antibody. (B) FACS analysis of EJp16 cells after propidium iodide staining at different times following tet removal. Percentages indicate the number of cells arrested in the G1 phase of the cell cycle, delimited by the bars in the graphics. (C) Cell size of EJp16 cells (I) cultured in tet or (II) after 6 days of tet removal, as measured by FACS analysis. (D) ROS levels as measured by FACS analysis after staining with the fluorescent probe DCF. The curves correspond to EJp16 cells (I) cultured in the presence of tet or (II) for 6 days following tet removal. (E) Percentage of recoverable colonies following p16 expression for different times. EJp16 cells were plated at a density of 100 cells per plate and were maintained in the absence of tet for 0 (control) up to 5 days, followed by tet addition. Cells were cultured for 14 more days followed by 10% formalin fixation and Giemsa staining. Black bars correspond to results with cultures in the absence of NAC, and gray bars correspond to results with cultures in 10 mM NAC, normalized to the number of colonies in the control plate. Results represent mean values of three experiments, and error bars show the standard deviation. (F) Representative plates from a colony formation assay.

An official website of the United States government
Here's how you know
Official websites use .gov
A
.gov website belongs to an official
government organization in the United States.
Secure .gov websites use HTTPS
A lock (
) or https:// means you've safely
connected to the .gov website. Share sensitive
information only on official, secure websites.
