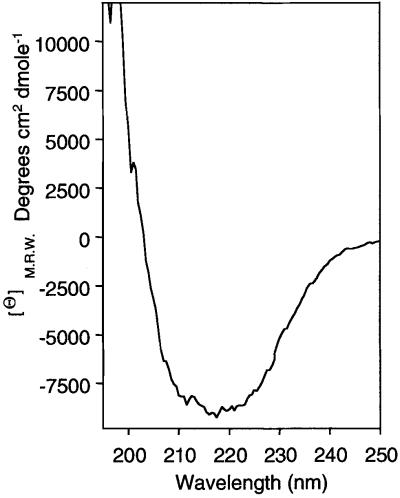
Fig. 3. CD spectrum of HEβ. The CD spectrum of purified HEβ (0.1 mg/ml) was monitored at 22°C in TNZ buffer [20 mM Tris–HCl pH 8.0, 10 mM NaCl, 0.1% (w/v) Zwittergent 3–14]. A minimum of four spectra were accumulated and the contribution of the buffer subtracted. Values of mean residue weight ellipticities (Θ) M.R.W. (degrees × cm2 × dmol–1) are indicated.

An official website of the United States government
Here's how you know
Official websites use .gov
A
.gov website belongs to an official
government organization in the United States.
Secure .gov websites use HTTPS
A lock (
) or https:// means you've safely
connected to the .gov website. Share sensitive
information only on official, secure websites.
