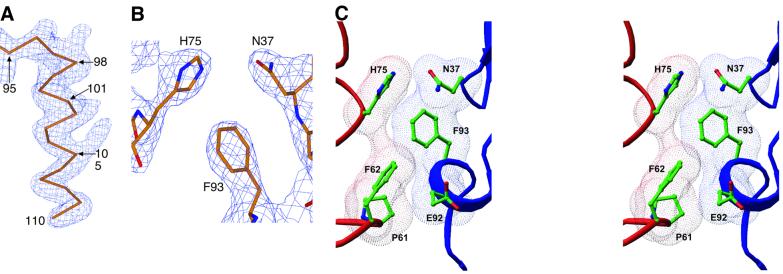
Fig. 3. Experimental electron density and homodimeric assembly. (A) Unbiased experimental electron density from SAD phases. The map is contoured around the CTE of the upstream subunit of the VDR DBD–DR3 structure, which is shown as a Cα trace. (B) A portion of the 2Fo = Fc electron density map showing intersubunit dimerization contacts. (C) Stereo view of the dimerization interface in a van der Waals surface representation. (A) and (B) were made with Xtalview (McRee, 1999), and (C) was prepared with Ribbons.

An official website of the United States government
Here's how you know
Official websites use .gov
A
.gov website belongs to an official
government organization in the United States.
Secure .gov websites use HTTPS
A lock (
) or https:// means you've safely
connected to the .gov website. Share sensitive
information only on official, secure websites.
