

Abstract
Poor infiltration of CD8+ T cells and dysregulation of major histocompatibility complex 1 (MHC-I) confer resistance to anticancer immunotherapies. Inhibition of the epigenetic regulator lysine-specific demethylase 1 (LSD1) has been shown to increase CD8+ T cell infiltration in head and neck squamous cell carcinoma (HNSCC). In this study, we aimed to elucidate the mechanisms of LSD1 inhibition in antitumor immunity in HNSCC to aid in the development of effective therapeutic strategies. LSD1 inhibition in syngeneic and chronic tobacco carcinogen-induced HNSCC mouse models increased recruitment of activated dendritic cells (DCs), as well as CD4+ and CD8+ T cells, and expression of interferon-gamma (IFNγ) in CD8+ T cells, CXCL9 in DCs, and CXCR3 in CD4+ T cells. Humanized HNSCC mice and patient data validated the inverse correlation of KDM1A with DC markers, CD8+ T cells, and their activating chemokines. Kdm1a knockout in mouse HNSCC and LSD1 inhibitor treatment of human HNSCC cells co-cultured with human peripheral blood mononuclear cells resulted in MHC-I upregulation in cancer cells. LSD1 inhibition promoted CD8+ T cell activation via a DC-dependent mechanism and induced efficient antigen presentation in CD8+ T cells. Finally, LSD1 inhibition increased H3K4me2 at the promoters of DC-related markers (BATF3 and CXCL9), T cell markers (CXCR3), and MHC-I (HLA-A). Overall, LSD1 inhibition in tumor cells upregulates MHC-I expression and stimulates CXCL9 secretion by DCs to enhance antigen presentation and promote CD8+ T cell activation via the CXCL9–CXCR3 signaling axis, resulting in increased IFNγ production. This may have implications for treating poorly immunogenic and immunotherapy-resistant cancers.
Keywords: LSD1, dendritic cells, HNSCC, antigen presentation, antitumor immunity, Kdm1a, CD8, CXCR3, CXCL9, IFNγ, MHC-I
Introduction:
Head and neck squamous cell carcinoma (HNSCC) is associated with significant mortality, with a survival rate of less than 50%. We showed that inhibition of the epigenetic regulator lysine-specific demethylase 1 (LSD1; encoded by KDM1A gene) reduces tumor progression (1) and promotes the infiltration of CD8+ T cells (2–4). However, the role of LSD1 in promoting HNSCC-specific mechanisms of antitumor immunity is not well understood and could offer new directions for treatment. A recent study has shown that an intratumoral immune triad comprising CD4+ T cells, CD8+ T cells, and dendritic cells (DCs) is required for efficient solid tumor elimination (5).
LSD1 is an epigenetic factor that modifies gene expression by demethylating histone H3 lysine residues, particularly H3K4me2 and H3K9me2 (6). However, the function of LSD1 in immune evasion and DC biology is not known. LSD1 inhibitors have been shown to reactivate silenced tumor suppressors, regulate immune checkpoints, and increase immune cell infiltration (2,7,8). However, the mechanistic understanding of these processes is not clear, which could help aid developing new therapeutic strategies for malignancies.
DCs (CD11c+ MHC-II+) have been categorized based on their roles and specific marker expression. These categories include conventional DC type I (cDC1, characterized by XCR1+), conventional DC type 2 (cDC2, identified by CD11b+), and migratory DCs (mDCs, marked by CD103+ or CCR7+).
cDC1 can efficiently present antigens to CD8+ T cells, thereby initiating robust cytotoxic T lymphocyte (CTL) responses that are essential for tumor elimination (9–12). In contrast, cDC2 relies on CD4-mediated help signals in immunotherapy (13,14). mDCs transport intact antigens to the lymph nodes and prime tumor-specific CD8+ T cells (15). These migratory DCs are capable of inducing CTLs (16).
IFNγ produced by CD8+ T cells and other immune cells can induce the expression of CXCL9 on DCs, which binds to CXCR3 on T cells, thereby recruiting additional CD8+ T cells to the tumor site. Additionally, the sensing of T cell-secreted IFNγ by neighboring tumor cells may enhance MHC-I expression and directly induce tumor cell death (17). The CXCL9/CXCR3 axis plays a critical role in regulating immune cell migration, differentiation, activation, and Th1 cell polarization (18). Cancer cells express neoantigens on the cell surface via MHC I (19). MHC-I plays a vital role in priming cytotoxic T cells, leading to antitumor responses (20). MHC-II on cDC1 cells is required for CD4+ T cells to facilitate efficient CD8+ T cell priming during antitumor immune control in murine models (21–23).
The objective of this study was to assess the impact of LSD1 inhibition on the infiltration of CD8+ T cells during the progression of HNSCC. We hypothesized that LSD1 inhibition facilitates the infiltration of CD8+ T cells through enhanced antigen presentation by DCs and the modulation of cytokines in HNSCC patients. To address variability, we investigated the mechanism of LSD1 using a syngeneic model, a chronic tobacco carcinogen-induced novel humanized mouse model, Kdm1a genetic knockout mouse models, ex vivo co-cultures, scRNA-seq, and validation through immunophenotyping. Additionally, we examined how LSD1 inhibition enhances antitumor immunity by activating the novel IFNγ-CXCL9-CXCR3 axis and MHC-I-mediated pathways.
Material and Methods:
Syngeneic 4MOSC1 model:
4MOSC1 cells were cultured in keratinocyte serum-free media and injected into the tongues of mice (2.5 × 10⁵ cells) on day 0. Three days post-injection, mice were treated daily with a high dose of SP2509 (SH; 40 mg/kg) or the respective vehicle. After 14 days of treatment, the mice were euthanized, and tongue tumor lesions were excised for flow cytometry, qPCR, and RNA sequencing (RNA-seq) analysis.
4-Nitroquinoline 1-oxide (4NQO1) induced mouse model:
All experiments were conducted with prior approval from the Institutional Animal Care and Use Committee (BUMC IACUC) at Boston University, utilizing both male and female C57BL/6J mice. The mice were administered 100 μg/mL 4NQO (dissolved in propylene glycol) in their drinking water for a duration of 16 weeks, followed by a transition to regular drinking water for the remainder of the study. The exposure of the tongue epithelia to 4NQO led to the development of early and advanced stages of the disease, including hyperplasia (weeks 0–8), papilloma/dysplasia (weeks 9–18), and HNSCC (weeks 18–25) (24). This model effectively mirrored the pathological changes observed in human HNSCC (25).
Following week 20, the mice received daily treatment with local applications of either vehicle, low-dose SP2509 (20 mg/kg), or high-dose SP2509 (40 mg/kg). The mice were euthanized after week 23, and "tongue tumor lesions," which included both invasive carcinomas and dysplasia, were collected for comprehensive evaluation. This analysis employed an unbiased approach utilizing scRNA-seq, RT-qPCR, flow cytometry, and histology across the respective treatment groups.
Humanized HNSCC stem cell mice model:
NOD-Prkdcem26Cd52Il2rgem26Cd22/NjuCrl (NCG) coisogenic, CRISPR genetically engineered immunodeficient mice (Charles River Laboratories), and pre-qualified graft versus host disease (GVHD) hPBMCs (Table S1), utilized to establish humanized mouse models, validated for engraftment. NCG mice are characterized by the absence of functional T cells, B cells, and Natural Killer (NK) cells, along with reduced levels of DCs and macrophages.
The NCG mice were injected with hPBMC (10,000,000/mouse) via their tail veins. After three days, authenticated and validated HNSCC stem cells obtained from Celprogren (cat. #36125–52P, Lot #2111210). HNSCC stem cells were orthotopically engrafted into the tongues of NCG mice (250,000 cells/mouse; n=10/condition) following our standard protocol (26,27). The mice were subsequently treated orally with either a vehicle or SP2509 (40 mg/kg, five times per week for four weeks) starting from days 3 to 28 post-HNSCC cell engraftment, after which the tongues were collected for analysis. Patient-derived tongue epithelial (PTE) HNSCC stem cells were also implanted into the tongue of the mice. Following a seven-day period, the humanized HNSCC mice received daily SP2509 treatment (40 mg/kg) for four weeks, after which they were euthanized, and tongue single-cell suspension was subjected to staining and flow cytometry to assess human immune cell populations.
Keratin 14 (Krt14) promoter-specific Kdm1a (LSD1) deficient mice:
As shown in our previous study (3), the conditional deletion of Kdm1a was performed by crossing Lsd1-floxed mice obtained from Stuart Orkin laboratory [Mass General Hospital, Boston] (28) with mice expressing Cre recombinase from the Krt14 promoter (29). These mice were subjected to 4NQO for HNSCC induction and tamoxifen-mediated deletion of Kdm1a. Kdm1a−/− mice were sacrificed 23 weeks post-4NQO exposure, and tongue tumor sections were stained to confirm Kdm1a deletion (Kdm1a−/−). Krt14 promoter-driven conditional Kdm1afl/fl mice treated with vehicle were designated as Kdm1aWT/WT, while tamoxifen-treated mice with deleted Kdm1a were designated as Kdm1a−/−. Immunofluorescence analysis was conducted on three mice per group, with three sections per mouse, followed by confocal microscopy and image analysis.
HSC3:hPBMC co-culture model:
A total of 500,000 HSC3 cells per well were cultured in a 6-well plate using DMEM supplemented with 10% fetal bovine serum (FBS) and 1% penicillin-streptomycin overnight (HLA typing was performed for both HSC3 and hPBMC and the results are provided in Table S2). The cells were then treated for 24 hours with one of the following: 1) vehicle, 2) SP2509 (1 µM), 3) scrambled single-guide RNA (sgRNA), 4) KDM1A sgRNA1, or 5) KDM1A sgRNA2. Following this treatment, the medium was replaced with fresh medium, and 20,000 hPBMCs were added for an additional 72 hours, resulting in a total experimental duration of 96 hours, including SP2509 treatment. Subsequently, the cells were fixed, stained, and analyzed via flow cytometry.
CXCL9 and CXCR3 blocking experiments:
1 µg of Human CXCL9 Antibody (R&D Systems #MAB392-SP, RRID #AB_3697858) and 1 µg of Human CXCR3 Antibody (R&D Systems #MAB160-SP, RRID #AB_2086754) blocking antibodies were added per well, followed by co-culture with hPBMCs. For the immune cell depletion study, 2 µg of anti-human CD4 antibody (RRID #AB_3697861), 2 µg of anti-human CD8 antibody (RRID #AB_3697860), and 1 µg of Ultra-LEAF™ Purified anti-human CD11c Antibody (RRID #AB_2814120) were administered. Detailed information regarding the antibodies is provided in Table S1.
Flow cytometry:
For in vivo tissue samples, cells were enzymatically dissociated using Collagenase P (Sigma, #11249002001) to generate single-cell suspensions. Following digestion, and for in vitro co-culture samples, cells were washed twice with cold PBS by centrifugation at 1200 rpm for 10 minutes at 4°C. Viability staining was performed using Zombie UV dye (BioLegend, #423108, RRID #AB_3697862) for 10 minutes at 4°C, followed by a wash with cold FACS buffer. Subsequently, surface marker staining was conducted using fluorochrome-conjugated antibodies, all procured from BioLegend. A comprehensive list of all antibodies utilized is presented in Table S1. In summary, CD11c (RRID #AB_3697863) and MHC-II (RRID #AB_893567) antibodies were employed to identify DCs. Specifically, XCR1+ CD11c+ MHC-II+ cells were used to identify conventional DCs (cDC1), CD8a+ CD11c+ MHC II+ cells were used to identify resident DCs (rDCs), and CD103+ CD11c+ MHC II+ cells were used to identify migratory DCs (mDCs). Additionally, CCR7, another marker of mDCs (30), was utilized in scRNA-seq studies. The defined T cell population included the CD3+TCRβ+ subpopulation of live CD45+ cells, which were further differentiated into CD4+ (T helper cells), CD8+ (cytotoxic T cells), NK1.1+ CD3+ (NKT cells), and NK1.1+ CD3− (NK cells) T cell subtypes. Human CD45 and CD3 antibodies were used to identify leukocytes and lymphocytes, respectively (Table S1).
Chromatin Immunoprecipitation (ChIP):
ChIP analysis was conducted using approximately 4 x 10⁶ cells with the SimpleChIP® Enzymatic ChIP Kit (Magnetic Beads), following the manufacturer's instructions (Cell Signaling Technology, #9003s). Anti-H3K4me2 Recombinant Rabbit Monoclonal Antibody (24H8L19) (Thermo Scientific, #701764, RRID #AB_2848510) and anti-H3K9me2 Polyclonal Antibody (Thermo Scientific, #39239, RRID #AB_3697864) were utilized to assess their interactions with HLA-A (MHC-I), Cxcl9, Batf3, and Cxcr3. Changes in H3K4me2 and H3K9me2 at the loci of these genes were detected using qPCR (primer details are provided in Table S1).
Ovalbumin (Ova) antigen presentation assay:
Seven-week-old female C57BL/6 mice (n = 4 per group) underwent orthotopic tongue implants of 5 × 10⁵ 4MOSC1 cells stably overexpressing ovalbumin (pHR-OVA/p2a/mCherry-CaaX) (RRID #Addgene_113030) (31). Tumor cells were inoculated on day 0, and from day 7 to day 21, the mice were treated orally with the LSD1 inhibitor SP2509 (40 mg/kg) or an equivalent volume of vehicle. On day 21, tumors were excised, minced, and enzymatically digested with Collagenase P at 37 °C. Single-cell suspensions were filtered through 70 µm filters and stained with H-2Kb SIINFEKL-PE tetramer (NIH Tetramer Core Facility) (RRID #AB_3068342) (32) and additional cell surface markers (RRID #AB_2875194, #AB_893625, #AB_2075239). Data acquisition was performed using a Cytek Aurora 5 laser 64 color spectral flow cytometer.
Single-cell RNA-seq:
C57BL/6J mice were administered 4NQO1 for 16 weeks, followed by regular drinking water (without 4NQO1) for the remainder of the experiment. At week 20, these mice were divided into three groups (n=6) and subjected to different treatments: 1) vehicle, 2) 4NQO; and 3) 4NQO+SP2509. At the time of sacrifice after week 23, tongue tumor lesions were cut to prepare single-cell suspensions, followed by scRNA-seq analysis of ~8000 cells/mouse (n=2/condition) using a 10X genomics kit according to the manufacturer's recommendations.
Single-cell suspensions were loaded on a 10X Genomics Chip B and processed using the 10X Genomics 3'v3 kit (10x Genomics, CA, USA). Following the 10X Genomics Chromium controller, the gel beads in emulsion (GEMs) were transferred to strip tubes and subsequently placed into a thermal cycler using the following parameters: 45 min at 53 °C, 5 min at 85 °C, and hold at 4 °C. The samples were then stored overnight at −20 °C. The next day, the samples were thawed at room temperature before the addition of the recovery agent to break the GEMs. Subsequently, cDNA was purified and amplified, and gene expression libraries were generated and purified. The size distribution and molarity of the libraries were assessed using a Bioanalyzer High-Sensitivity DNA Assay (Agilent Technologies, Lexington, MA, USA). The libraries were then pooled at 5nM and sequenced on an Illumina NextSeq 500 instrument at a 1.5– 1.9 pM input and 1% PhiX spike in using 150 cycles High Throughput flow cells (Illumina, San Diego, CA, USA) in several sequencing runs resulting in 43,669 – 47,157 mean reads per cell.
scRNA-seq data analysis:
The data were processed with Cell Ranger v3.1.0 (RRID #SCR_017344) using the mouse reference genome mm10 v2.1.0. SingleCellTK (RRID #SCR_026813) was used to characterize low-quality cells (33). Matrix files were loaded into Seurat v5.0.3 (RRID #SCR_016341) (34) with no initial cutoffs to produce a Seurat object from which low-quality cells were removed. Low-quality cells were defined as those with > 20% reads coming from mitochondrial genes, those with less than 400 genes detected, cells with > 50% contamination as determined by decontX, or cells that were marked as doublets by all scDblFinder (RRID #SCR_022700) metrics (35,36). Filtering reduced the total number of cells from 76275 to 50319.
Data were normalized by library size and log-transformed using normalized data on the RNA slot. Clustering was performed with 40 PCs at a resolution of 1 using 5000 variable features. Cells were scored for the cell cycle, and singleR (RRID #SCR_023120) was used to classify cells at the single-cell level using the Immgen (RRID #SCR_021792) database (37,38). Cell labels were extended to cluster-level labels based on the majority cluster labels and cell marker genes.
The immune cells were identified as a subset and re-clustered using 20 PCs at a resolution of 0.3. Marker genes were used to further define the immune subtypes. Differentially expressed genes were found for each cluster using MAST, with batch as a fixed effect. The DCs were a subset and re-clustered using 20 PCs with a resolution of 0.3. Langerhans cells were removed from downstream analyses because of their distinct transcriptomic profiles. T cells were subsets of the immune compartment by selecting the "T/NK", "TGD", and "ILC2" clusters. They were re-clustered using ten PCs at a resolution of 0.4. Differential expression analysis for the Epithelial and T cell compartments (excluding ILC2s due to their distinct transcriptional signature) was performed between treatments in a pairwise manner using MAST, including batch as a fixed effect.
CellChat v2.1.2 was run on the RNA data slot and separately on the 4NQO control and SP2509 treated samples (39). Overexpressed genes were identified using a 1% threshold. Communication probabilities were computed using trim = 0.05; type = truncated mean. Communications were filtered to include those with at least five cells. The two CellChat objects were then merged to compare their interaction occurrences and strength. Software/package details are in Table S1.
RNA extraction and analysis:
TRIzol reagent was used to extract total RNA. RNA-seq and gene set enrichment analyses (GSEA) were performed as described in our previous studies (40) using 400 ng of total RNA that was sequenced with Novoseq (41,42). Raw FASTQ sequencing reads were mapped to the M. musculus reference genome (mm10). Differential gene expression analysis was performed using DESeq2 in the R/Bioconductor software. Software/package and reagent details are in Table S1.
Pathological characterization and immunostaining: H&E staining and immunofluorescence were performed on n=4/group and four sections from each mice. Tongue sections were evaluated for pathology as established earlier (3).
The Cancer Genome Atlas (TCGA) analysis:
TCGA data were obtained using the TCGABiolinks R/Bioconductor package. Immune infiltration analysis data were acquired from the TIMER 2.0, web portal(43).
Ingenuity Pathway Analysis (IPA):
IPA was performed using IPA software (Qiagen) (RRID #SCR_008653) (44,45). We have used RNA-seq differential gene expression (DGE) data generated with DESeq2 (R/Bioconductor software) to perform the analysis. The genes were included with the criteria using FDR value <0.05 and Z score ≥ ±0.25.
Statistical analysis:
Data analysis for all experiments was performed using the Brown-Forsythe and Welch ANOVA tests.
Ethics statement:
The study was approved by the BU IACUC committee.
Results:
The LSD1 inhibitor (SP2509) enhanced the accumulation of CD4+, CD8+ T cells, and DCs in a syngeneic HNSCC mouse model.
To assess the role of LSD1 in tumor immunity, a syngeneic 4MOSC1 mouse model was employed (Figure 1A). Treatment with the small-molecule LSD1 inhibitor SP2509 resulted in a reduction of tumor volume (Figure 1B, Figure S1A) and decreased expression of Kdm1a (Figure 1C). Flow cytometry analysis indicated that the SP2509-treated group exhibited a significant accumulation of immune cells (Figure 1D–E), particularly CD4+ (p<0.01) and CD8+ (p<0.001) T cells, natural killer T (NKT) cells (p<0.001), and natural killer (NK) cells (p<0.001), in comparison to the vehicle treatment group.
Figure 1: LSD1 Inhibition by Local SP2509 Promotes Infiltration of DCs, CD4+, and CD8+ T Cells in HNSCC.
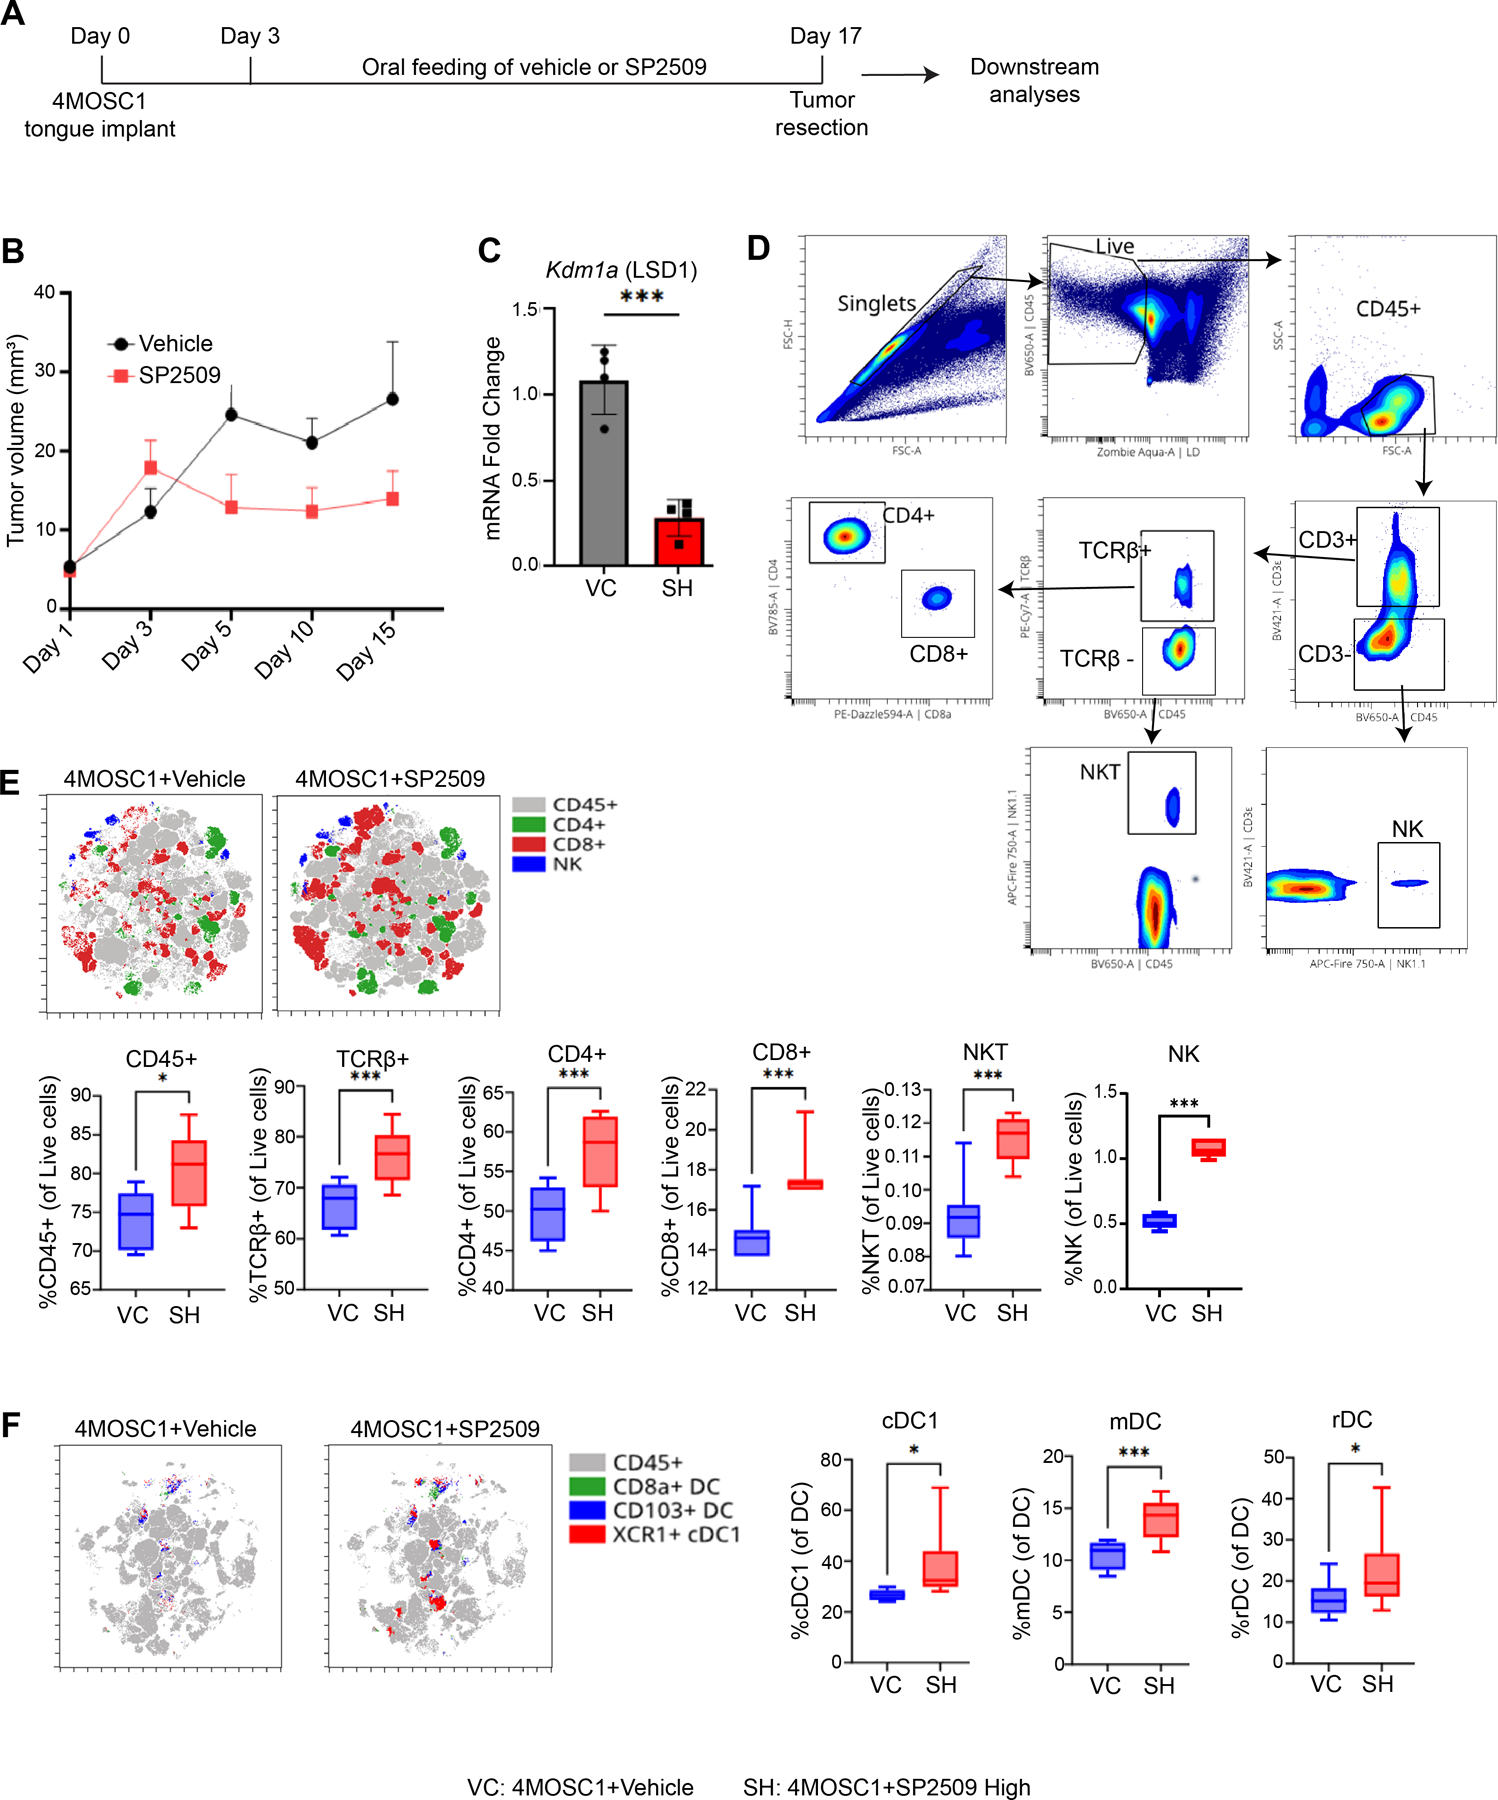
A) Experimental design illustrating the implantation of tobacco carcinogen-induced 4MOSC1 primary cells into the tongues of C57BL/6J mice. Following a 3-day implantation period, SP2509 in corn oil was administered five times a week from days 3 to 17, followed by multicolor flow cytometry and RNA-seq. B) Measurement of tumor volume at 3 to 5-day intervals for both vehicle and SP2509-treated mice. C) Analysis of Kdm1a (LSD1) expression levels through quantitative real-time polymerase chain reaction (RT-qPCR), comparing vehicle control (VC) and SP2509 high (40 mg/kg) (SH) groups using the 2(-ΔΔCT) method. D) Gating strategies for detecting immune cell surface markers via multicolor flow cytometry. E) t-SNE and box plots illustrating elevated levels of immune cells in SP2509-treated mice. F) t-SNE and box plots depicting increased levels of specialized DCs [cDC1 (XCR1+ CD11c+ MHC class II+), mDC (CD103+ CD11c+ MHC class II+), and rDC (CD8α+ CD11c+ MHC class II+)] in vehicle versus SP2509-treated mice. (*p<0.05, **p<0.01, ***p<0.001, ****p<0.0001).
Furthermore, analysis of antigen-presenting cells (APCs) revealed that SP2509 treatment also enhanced the recruitment of CD8a+ DCs (resident DCs or rDCs) (p<0.01), CD103+ DCs (migratory DCs or mDCs) (p<0.001), and XCR1+ DCs (conventional DC1 or cDC1) (p<0.01) (Figure 1F, Figure S1B). Figure showed that these findings demonstrate that LSD1 inhibition in the 4MOSC1 syngeneic model (which corresponds to pre-existing HNSCC) facilitated SP2509 promoted the infiltration of CD4+ and CD8+ T cells, NKT and NK cells, and DCs, which could play a potentially contributing antitumor immunity. However, analysis of spleen tissues from SP2509-treated mice did not reveal significant differences in these immune populations (Figure S1C–E).
LSD1 inhibition enhanced activation of CD4+, CD8+ T cells, and DCs in chronic 4NQO1-induced HNSCC.
To elucidate the underlying mechanisms and reproducibility of these findings, we employed a chronic tobacco carcinogen, 4NQO1, to induce a HNSCC model (Figure 2A). The 4NQO1 compound facilitates the transformation of normal tongue epithelium through stage-specific mutations analogous to those observed in human HNSCC. Mice treated with SP2509 exhibited a dose-dependent reduction in Kdm1a expression (Figure 2B), as well as a decrease in pathologically invasive tumor lesions (Figure 2C) and a quantification of these invasive lesions (Figure 2D).
Figure 2: LSD1 Inhibition Enhances T-Cell Infiltration in Chronic 4NQO-Induced Progressive HNSCC Mouse Tongue.
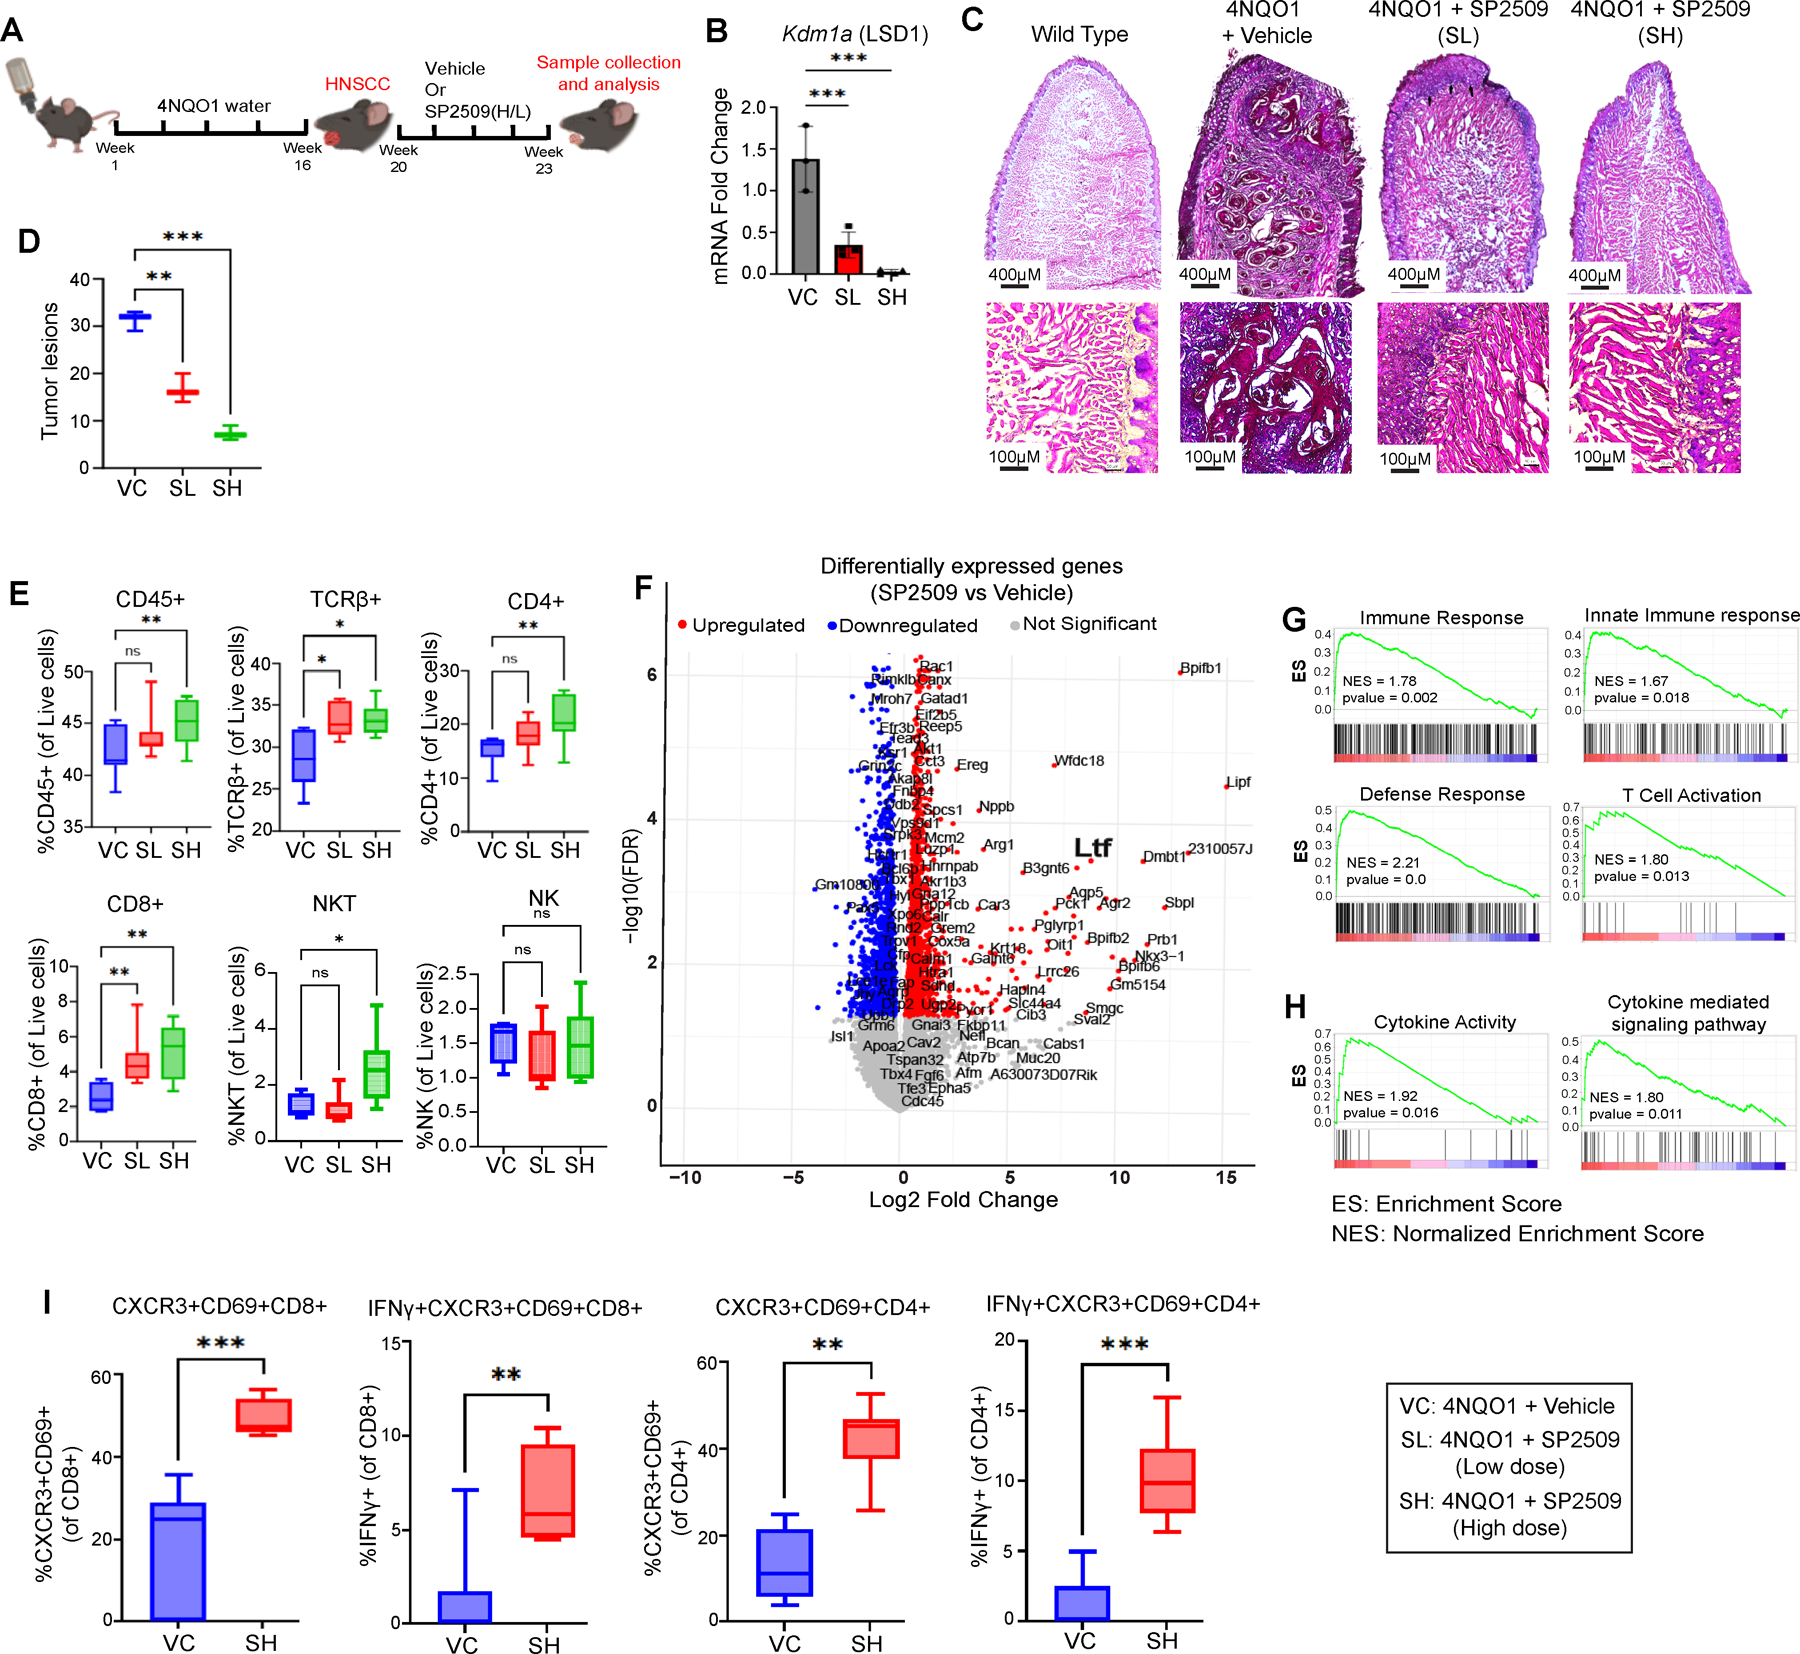
A) The experimental design indicates that C57BL/6J mice were administered 4NQO for 16 weeks, followed by regular drinking water (no 4NQO) for the remainder of the experiment to induce HNSCC. Vehicle or SP2509 treatment commenced at week 20 and continued until week 23. B) RT-qPCR revealing reduced expression of Kdm1a following treatment with low-dose (SL) or high-dose (SH) SP2509. C) H&E staining of mouse tongues treated with SL or SH of SP2509. D) Box plots quantifying tumor lesions per tongue evaluated by H&E staining. E) Flow cytometry analysis characterizing the immune cell (T/NK cells) population in mouse tongues from SL and SH treatment groups. F) Volcano plot depicting differentially expressed genes between SP2509 and vehicle-treated mice. G) GSEA of tongue tumors treated with SP2509 demonstrating significant upregulation of innate immune response and T-lymphocyte activation-related genes compared to vehicle control. H) GSEA analysis indicating increased cytokine activity following SP2509 treatment. I) Flow cytometry data revealing CXCR3 and IFNγ expression in activated CD4+ and CD8+ T cells. (*p<0.05, **p<0.01, ***p<0.001, ****p<0.0001).
As illustrated in Figure 2E, SP2509 treatment led to an increase in CD45+, TCRβ+, CD4+ T cells, CD8+ T cells, and NKT cells compared to the vehicle treatment group (Figure S2A, S2B). Subsequently, we assessed markers of activation (CD69+) and effector function (CD44+) simultaneously. SP2509 treatment significantly enhanced the activation of CD4+ and CD8+ T cells, NKT, and NK cells, which possess effector functions (Figure S2C). However, spleens from SP2509-treated mice did not demonstrate significant differences in these immune populations (Figure S3A–C). Collectively, these results indicate that SP2509 promotes the infiltration and activation of effector DCs and T cells within tongue tumors.
Prior studies have demonstrated enhanced survival in HNSCC patients with CD8+ T cell activation and IFNγ production when anti-PD1 therapy is used (46). To investigate this phenomenon in our study, we used a 4NQO-induced HNSCC mouse model to assess CD8+ T cell activation and IFNγ production in conjunction with anti-PD1 therapy and SP2509 treatment. Anti-PD1 and SP2509 therapy were found to significantly increase CXCR3 and IFNγ expression in CD8+ T cells (p<0.01) (Figure S3D).
LSD1 inhibition enhances Ifng, Cxcr3 and Cxcl9 expression during activation of DCs.
To investigate the mechanism underlying DC accumulation, we performed a comprehensive transcriptomic analysis using bulk RNA-seq of tumor-bearing mice treated with or without SP2509. Initial findings confirmed that SP2509 upregulated immune response-related genes, including Ltf, which are associated with T cell activation (Figure 2F, Table S3). GSEA revealed that SP2509 treatment resulted in positive enrichment of pathways related to overall immune response, innate immune response, defense response, T cell activation, cytokine activity, and cytokine-mediated signaling networks (P<0.05). These changes may contribute to the activation of CD8+ T cells (Figure 2G, H).
IPA of differentially expressed genes indicated the activation of a cytokine network involving Ifng, Cxcr3, and Cxcl9, which has the potential to promote the proliferation of cytotoxic T lymphocytes (CTLs) (Figure S3E). Finally, validation using flow cytometry demonstrated that LSD1 inhibition resulted in increased expression of CXCR3 and IFNγ in activated (CD69+) CD4+ and CD8+ T cells, respectively (Figure 2I).
LSD1 inhibition enhances Batf3, Cxcl9, and Cxcr3 expression, and DC infiltration.
We hypothesized that the effects of LSD1 inhibition on CD8+ T cell infiltration and activation are associated with enhanced antigen presentation activity. To investigate cellular changes in response to LSD1 inhibition, we conducted scRNA-seq experiments. Seurat cluster analysis identified the major cellular compartments (Figure 3A), while a focused analysis within the immune compartment revealed that SP2509 treatment promoted the expression of specific DC types (Figure 3B, Figure S4A). The accumulation of DCs was further confirmed by the upregulation of the DC-specific marker Batf3 (Figure 3C, D). Batf3, a critical transcription factor in DCs, plays an essential role in antigen presentation, cytotoxic T-cell activation, and overall immune response (47).
Figure 3: LSD1 Inhibition Promotes Activation and Infiltration of DCs in Progressive 4NQO HNSCC Mice.

A) UMAP representation of cell clusters identified through scRNA-seq. B) UMAP representation of DC extraction from a pool of total cell clusters. C) Feature plot and violin plot representing Batf3 expression in DCs following SP2509 treatment. D) Violin plot illustrating Batf3 expression across various types of DCs with SP2509 treatment. E) RT-qPCR showing increased expression of Batf3, Cxcr3, and Cxcl9 with SL (SP2509, low- dose) and SH (SP2509, high- dose) treatment. F) Box plot representing the elevated overall DC percentage in the SL and SH treatment groups as determined by flow cytometry. G) Box plot illustrating the elevated percentage of specialized DCs in SL and SH treatment groups using flow cytometry. H) Box plot depicting the percentage of activated (CD86+) specialized DCs in SL and SH treatment groups using flow cytometry. (*p<0.05, **p<0.01, ***p<0.001, ****p<0.0001).
RT-qPCR analysis confirmed the enhanced overall expression of DC-specific factors Batf3, Cxcl9, and the T cell-related factor Cxcr3 (Figure 3E). Flow cytometric analysis demonstrated that SP2509 significantly increased the expression of overall DCs (Figure 3F), as well as specific subtypes, including conventional DC1 (cDC1), migratory DC (mDC), and resident DC (rDC) (Figure 3G; Figure S4B). CD86, a well-established activation marker for DCs, was analyzed alongside a DC-specific marker. Treatment with SP2509 resulted in an increase in activated (CD86+) cDC1, mDC, and rDC populations (Figure 3H). Collectively, our data provide compelling evidence that SP2509 enhances the activation of the DC (CD86+) subpopulation, which is known to play a critical role in efficient antigen presentation to T cells (48).
LSD1 inhibition upregulates MHC-I in the epithelial compartment.
Consistent with this finding, IPA of bulk RNA-seq data indicated an increase in antigen presentation mediated by MHC-I, as well as enhanced DC migration and maturation (Figure 4A). To assess specific alterations in epithelial and immune cells, scRNA-seq data were subjected to cell-cell communication and IPA analysis. CellChat analysis demonstrated that SP2509 promoted interactions and strengthened the engagement between dendritic cells (DCs) and T cells with epithelial cells (Figure 4B, Figure S4C). Differential expression analysis of epithelial cells in HNSCC treated with SP2509, followed by IPA canonical pathway analysis, revealed activation of interferon beta (Ifnb) and Ifng signaling, enhanced antigen presentation, and reduced glucose metabolism (Figure S4D).
Figure 4: LSD1 Inhibition Reprograms Epithelial Cells in HNSCC to Upregulate MHC Class I and Enhance Cytokine Signaling Networks to Promote Infiltration of T-Cells and DCs.

A) IPA of RNA-seq data indicating activation of DC migration, antigen presentation, and DC maturation gene network upregulation following SP2509 treatment. B) Cell Chat analysis illustrating the directionality of signals and their effects on epithelial cells, T cells, or DCs under varying conditions. A comparison of cell-cell interactions in SP2509 treatment versus vehicle in 4NQO mouse tongues was conducted via Cell Chat. Blue indicates higher values in SP2509, while red indicates higher values in 4NQO. C) Altered pathways within the T cell compartment post-SP2509 treatment. D) Violin plot showing elevated levels of TCRβ genes within the T cell compartment. E) Violin plots present increased levels of Ifng in T cells, as well as cytokines such as Cxcl9 in DCs and Cxcr3 in T cells. F) Altered expression of MHC-I genes following SP2509 treatment. G) Percentage of MHC class I positive epithelial cells determined by flow cytometry. scRNA-seq data is presented in violin plots, while flow cytometry and RT-qPCR data are shown in box plots. H) Ova+ CD8+ T cell infiltration in 4MOSC1 mice treated with SP2509 compared to vehicle-treated mice. I) Status of T cells in 4MOSC1 (OVA) mice following SP2509 treatment compared to vehicle. (*p<0.05, **p<0.01, ***p<0.001, ****p<0.0001).
The differential expression of immune cells in response to SP2509 indicated an enhancement in Th1 and Th2 pathways, T cell receptor (TCR) signaling, interferon signaling, and DC maturation (Figure 4C). Notably, analysis of specific cell types showed that the SP2509 treatment group exhibited elevated levels of TCR subunits TCRβC1 and TCRβC2 (encoded by Trbc1 and Trbc2, respectively) (Figure 4D), as well as increased expression of Cxcl9 in DCs, and Cxcr3 and Ifng in T cells (Figure 4E; Figure S5A). SP2509 also stimulated pathways in immune cells and induced the expression of MHC-I subunits (H2-aa, H2-ab1, H2-eb1, H2-dma, and H2-dmb1) (Figure 4F and Figure S5B). Finally, to validate these findings, flow cytometry analysis of MHC-I demonstrated that SP2509 promotes upregulation of MHC-I compared to the vehicle in HNSCC (Figure 4G). Collectively, these results suggest that LSD1 inhibition in HNSCC upregulates MHC -I in epithelial cells, and Ifng, Cxcl9, and Cxcr3 in immune cells, while promoting T cell and DC infiltration, thereby enhancing the potential for effective antigen presentation.
Ovalbumin (Ova)-Tetramer antigen presentation assay demonstrates enhanced antigen presentation following LSD1 inhibition.
To assess efficient antigen presentation within the tumor microenvironment (TME), we utilized the Ova-tetramer assay. This assay quantifies the antigen presentation of CD8+T cells post-treatment (32,49). Blocking the inhibition of LSD1 significantly increased the number of T lymphocytes that infiltrated the tumors. The proportions of TCRβ+ and CD8+ T cells among total lymphocytes were markedly elevated (p<0.001) in tumors treated with SP2509 (Fig. 4H). Furthermore, following treatment, the fraction of SIINFEKL/H-2Kb tetramer-positive CD8+ T cells was significantly increased (p<0.001) (Fig. 4I).
Humanized HNSCC stem cell mouse model enhances CD4+ and CD8+ T cell activation and DC markers following SP2509 treatment.
To evaluate the functional effects of LSD1 inhibition in clinical HNSCC specimens, we developed a novel humanized HNSCC stem cell model (bioRxiv 2025.06.13.659630). NOD-Prkdcem26Cd52Il2rgem26Cd22/NjuCrl (NCG) coisogenic CRISPR genetically engineered immunodeficient mice lack functional T, B, and NK cells, and have mutated SRFα to improve engraftment. NCG mice were humanized through tail vein injection of hPBMC, followed by orthotopic implantation of HNSCC stem cells into the tongue (26,27). The human cell marker profile of HNSCC stem cell is in Table S4. Mice receiving oral treatment with either vehicle or SP2509 for three weeks exhibited a reduction in tumor size, along with changes in tissue morphology and pathology, and maintained overall body condition (Figure 5A–C). SP2509 treatment significantly increased CD4+ and CD8+ T cell infiltration into tongue tumors (p<0.05) (Figure 5D, E), with activation evidenced by the presence of activated CD4+ (CD69+CD4+) and CD8+ (CD69+CD8+) T cells (Figure 5F). RT-qPCR analysis demonstrated that SP2509 enhanced the expression of DC-specific markers Batf3 and Cxcl9, as well as the T cell-specific marker Cxcr3 (Figure 5G). While no model is perfect for evaluating anticancer effects, the combination of various in vivo and humanized HNSCC mouse models corroborated our findings.
Figure 5: LSD1 Inhibition by SP2509 Attenuates HNSCC in a Humanized Mice Model and Promotes Batf3, Cxcr3, Cxcl9, and MHC-I. The Cancer Genome Atlas (TCGA) Data Indicates an Inverse Correlation Between KDM1A and Immune Infiltration -Related Genes.

Humanized mice were generated by initially injecting NCG mice with hPBMC, followed by HNSCC stem cell implantation in the tongue after 3 days. A) Measurement of tumor volume at 3 to 7-day intervals for vehicle or SP2509-treated mice. B) H&E staining reveals that SP2509 attenuated the tumor phenotype. C) Mice treated with SP2509 exhibited improved overall health compared to the vehicle-treated group. D) Box plot indicating nearly unchanged levels of immune cells (CD45+) in the tongues of SP2509-treated mice compared to vehicle. E) The SP2509-treated group demonstrated elevated levels of total T cells (CD3+), including significant infiltration of CD4+ and CD8+ T cells, along with increased levels of NKT and NK immune cells in the mouse tongue. F) Box plots illustrating activation (CD69+) of CD4+, CD8+, NKT, and NK immune cells in the tongues of SP2509-treated mice. G) RT-qPCR revealing higher expression of Batf3, Cxcr3, and Cxcl9 with both high and low dose SP2509 treatment. TCGA data indicates that KDM1A has an inverse correlation with immune infiltration-related genes, including H) immune cell marker gene CD45 (PTPRC), CD4, and CD8B T cells, I) DC marker genes ITGAX (CD11c) and XCR1, and J) cytokine genes CXCL9, CXCR3, and IFNγ. K) Negative correlation of DC infiltration with KDM1A expression. (*p<0.05, **p<0.01, ***p<0.001, ****p<0.0001).
KDM1A has an inverse correlation with IFNγ, CXCR3, and CXCL9 in clinical tumors.
To assess the relevance of findings from murine and humanized HNSCC models to human tumor samples, we analyzed patient data from The Cancer Genome Atlas (TCGA). Patients were categorized into human papillomavirus (HPV)-negative (Figure 5H–J, Figure S6A–C) and HPV-positive (Figure S6D–F) groups for correlation analysis. In HPV-negative HNSCC patients, KDM1A demonstrated a significant inverse correlation with the hematopoietic cell marker gene PTPRC (CD45) as well as the T cell marker genes CD4, CD8A, and CD8B (Figure 5H). Additionally, we observed that KDM1A mRNA expression was negatively correlated with specific DC markers ITGAX (CD11C) and XCR1 (Figure 5I). The DC-specific chemokine CXCL9, the CD8-specific chemokine receptor CXCR3, and the CD8 cell-activating cytokine IFNG were also inversely correlated with KDM1A expression (Figure 5J). Furthermore, immune infiltration analysis indicated a significant negative correlation between KDM1A expression and activated DCs (Figure 5K).
HNSCC epithelial cells undergo reprogramming through Kdm1a knockout or inhibition, resulting in the secretion of IFNγ, which subsequently stimulates MHC-I expression in HNSCC, as well as CXCR3 in CD8 T cells and CXCL9 in DCs.
To investigate whether tongue HNSCC epithelial cells are reprogrammed to enhance MHC-I expression and signal immune cells, we conducted an analysis of Krt14 promoter-specific Kdm1a deletion (Kdm1a−/−) in mouse tongue tissue, and co-cultured immune cells following the knockout of Kdm1a in HSC3 cells (an HNSCC cell line). Our previous studies indicated that Kdm1a knockout in epithelial cells diminishes HNSCC and reduces the expression of critical oncogenes (3). Immunofluorescence analysis of Kdm1a−/− HNSCC tongues demonstrated an upregulation of TCRβ, MHC-I, and CD8+ T cells in comparison to tongues from Kdm1aWT/WT mice (Figure 6A, Figure S7A). Furthermore, treatment with SP2509 resulted in increased levels of TCRβ, MHC-I, and CD8+ T cells compared to the tongues of vehicle-treated mice (Figure 6B, Figure S7B).
Figure 6: Deletion of Kdm1a in Krt14-Expressing HNSCC Mouse Tongue, KDM1A sgRNA Treatment, or SP2509 Treatment in Co-Culture Increases MHC-I+, TCRβ+, and CD8+ T Cells.

A) Specific deletion of Kdm1a in tongue epithelial cells results in increased expression of MHC-I, TCRβ, and CD8+ cells compared to 4NQO-induced mouse HNSCC tongue tumors. B) SP2509 treatment enhances the expression of MHC-I, TCRβ+, and CD8+ immune cells in 4NQO-induced mouse HNSCC tongue tumors. C) KDM1A sgRNA treatment followed by flow cytometry analysis of the KDM1A sgRNA-treated co-culture model shows an increase in TCRβ+, CD4+, and CD8+ cells. D) Presence of IFNγ+CD4+, IFNγ+CD8+, CXCR3+CD4+, and CXCR3+CD8+ T cell populations. E) DC (CD11c+ MHC class II+), CXCL9+ DCs, and MHC-I+ Epcam+ cancer epithelial cells. F) SP2509 treatment followed by flow cytometry analysis in the HSC3:hPBMC co-culture model reveals an increase in TCRβ+, CD4+, and CD8+ cells. G) Presence of IFNγ+CD4+, IFNγ+CD8+, CXCR3+CD4+, and CXCR3+CD8+ T cell populations. H) DCs (CD11c+ MHC class II+), CXCL9+ DCs, and MHC-I+ Epcam+ cancer epithelial cells. (*p<0.05, **p<0.01, ***p<0.001, ****p<0.0001).
To assess whether HSC3 cells are reprogrammed to stimulate CD8+ T cells and DCs, we established a co-culture model involving HSC3 cells and hPBMCs. Initially, HSC3 cells were transfected with KDM1A sgRNA construct or scrambled control for 24 hours, followed by multiple washes and a subsequent 72-hour incubation with hPBMCs to evaluate effects on specific immune cells, chemokines, and cytokines. Both KDM1A knockout and LSD1 inhibition resulted in significant increases in TCRβ, MHC-I, and CD8+ T cells compared to their respective controls (Figure S7C–D). Flow cytometry analysis revealed elevated levels of TCRβ+, CD4+, and CD8+ T cells, as well as an increased population of DCs (CD11c+ MHC-I+) in the Kdm1a knockout group (Figure 6C, S7E). Co-culture of HNSCC cells with hPBMCs demonstrated that Kdm1a knockout enhanced IFNγ production in CD4+ and CD8+ T cells, CXCL9 expression in DCs, and MHC-I expression in epithelial cells (EpCAM+) (Figure 6D, E).
Subsequently, HSC3 cells were treated with SP2509 for 24 hours, washed with PBS to eliminate residual SP2509, and incubated with hPBMCs for 72 hours. The results indicated that SP2509 treatment led to a statistically significant increase in TCRβ+, CD4+, and CD8+ T cells (Figure 6F), as well as enhanced IFNγ production in CD8+ and CD4+ T cells, CXCR3 expression in CD4+ and CD8+ T cells, and increased levels of CXCL9+ DCs and MHC-I in EpCAM+ cells (Figure 6G–H). Overall, these findings demonstrate that LSD1 inhibition and KDM1A genetic deletion reprogram HSC3 cells to upregulate MHC-I and secrete IFNγ, thereby stimulating the CXCL9-CXCR3 axis and enhancing antigen presentation by DCs, which ultimately increases CTL production and promotes antitumor immunity.
The effects of LSD1 inhibition on CD8⁺ T cell activation are mediated through DCs.
To evaluate changes in immune cells and their activation through the CXCL9-CXCR3 pathway, we performed blocking experiments utilizing anti-human CXCL9 and anti-human CXCR3, as demonstrated in previous studies (50,51). Co-culture of HSC3 and hPBMCs, treated with LSD1 inhibitors in combination with anti-CXCL9 or -CXCR3 antibody in respective groups. Blocking with anti-CXCL9 or -CXCR3 abolished the effect of LSD1 inhibition as seen a significant reduction (p<0.001) in the proliferation of immune cells (CD45+), as well as CD4⁺ and CD8⁺ T cells, DCs, and IFNγ production (Figure 7A–D).
Figure 7: LSD1 Regulates IFNγ Production Through the CXCL9-CXCR3 Axis and Modulates MHC-I Gene Expression Through Histone H3K4 and H3K9 Modifications.

A) CD45+ and TCRβ+ immune cells were significantly increased following SP2509 treatment compared to the vehicle group, while subsequent treatment with anti-CXCL9 (Anti-CXCL9+SP2509) and anti-CXCR3 (Anti-CXCR3+SP2509) resulted in a significant decrease. B-C) CD4+ and CD8+ T cells, along with their activation and cytotoxic effects mediated by IFNγ production, were significantly reduced following CXCL9 and CXCR3 blocking in relation to the LSD1 inhibited group. D) The DC (CD11c+ MHC class II+) population was significantly elevated following SP2509 treatment compared to the vehicle but also reduced after CXCL9 and CXCR3 blocking. E) The status of CD8+ T cell proliferation following SP2509 treatment in combination with CD4+ T cell, CD8+ T cell, and DC depletion. F-G) Levels of H3K4me2 and H3K9me2 were visibly increased following SP2509 treatment. H-I) MHC class I gene HLA-A enrichment was significantly increased in H3K4me2, while it was significantly decreased in H3K9me2 ChIP-qPCR. J) Enrichment status of Cxcl9, Cxcr3, and Batf3 in H3K4me2 and H3K9me2 following SP2509 treatment in 4MOSC1 HNSCC mice. (*p<0.05, **p<0.01, ***p<0.001, ****p<0.0001).
To investigate whether the effects of LSD1 inhibition on CD8+ T cell activation are mediated through DCs, we conducted selective depletion of CD4+ T cells, CD8+ T cells, and CD11c+ DCs using specific monoclonal antibodies (Table S1). The depletion of CD11c+ DCs resulted in a significant reduction in CD8+ T cell levels (p<0.01), and this reduction was not alleviated by LSD1 inhibition. In contrast, depletion of CD4+ T cells did not significantly impact CD8+ T cell abundance following LSD1 inhibition (Fig. 7E). These findings indicate that LSD1 inhibition promotes CD8+ T cell activation via a DC-dependent mechanism.
LSD1 regulates H3K4me2 and H3K9me2 in the MHC-I gene.
To assess the impact of LSD1 on the methylation status of H3K4 and H3K9, we conducted an immunofluorescence analysis of HSC3 cells. The analysis revealed increased levels of H3K4me2 and H3K9me2 following LSD1 inhibition (Figure 7F–G; Figure S7F–G). A recent study indicated that LSD1 operates through an autoregulatory mechanism (52).
To further investigate chromatin modifications, we performed ChIP assay using H3K4me2 and H3K9me2 antibodies to evaluate the status of these di-methylated histones on the MHC-I gene HLA-A and on Kdm1a. The data demonstrated a significant (p<0.0001) upregulation in the enrichment of HLA-A in H3K4me2 and a downregulation in H3K9me2 (p<0.001) upon LSD1 inhibition compared to the vehicle control (Figure 7H–I). Additionally, we observed a significant (p<0.0001) negative enrichment of KDM1A in H3K4me2; however, no significant alterations were noted in H3K9me2 (Figure S7H–I), suggesting a potential self-regulatory function of LSD1.
We utilized ChIP-qPCR to evaluate changes in H3K4me2 and H3K9me2 in the DC-related markers Batf3, Cxcl9, and the T cell marker Cxcr3. The results indicated that Batf3, Cxcl9, and Cxcr3 were significantly upregulated (p<0.01) in H3K4me2, whereas Batf3 and Cxcl9 exhibited significant downregulation (p<0.01) in H3K9me2 following LSD1 inhibition (Figure 7J). These findings suggest that LSD1 plays a regulatory role in these genes.
Discussion
Increasing evidence suggests that the evolution of HNSCC involves dynamic interactions among various cell subpopulations, influenced in part by epigenetic changes within tumor cells and their surrounding microenvironment. This study aimed to investigate the role of LSD1 inhibition in promoting the activation of CD8+ T cells and enhancing antitumor immunity. Our prior research has demonstrated that aberrant activation of LSD1 contributes to the progression of HNSCC (1,3). The LSD1 irreversible inhibitor Bomedemstat has demonstrated efficacy in inhibiting small-cell lung carcinoma (SCLC)(53).
Inhibition of LSD1 has been demonstrated to upregulate MHC-I expression in small cell lung cancer (SCLC)(54). LSD1 plays a critical role in regulating gene expression, DNA demethylation, and the upregulation of CD8+ T cells (8). However, the mechanisms underlying the infiltration and activation of CD8+ T cells, as well as MHC-I upregulation, remain poorly understood. Our research has identified novel mechanisms of LSD1 involvement in 1) DC-mediated antigen presentation through the IFNγ-CXCL9-CXCR3 axis, and 2) the reprogramming of TME to enhance and upregulate MHC-I molecules in vivo in both murine and humanized models relevant to clinical HNSCC.
MHC class I peptides, such as HLA-A and HLA-B in humans, as well as H2-Q7 and H2-Eb1 in mice, interact with the T-cell receptor β(55–57). Sustained high levels of IFNγ production by TH1 cells or cytotoxic T lymphocytes (CTLs) typically necessitate T-cell receptor (TCR)-mediated recognition of antigens presented by MHC class I molecules(58). C-X-C motif chemokines, specifically CXCL9, CXCL10, and CXCL11, are synthesized in response to IFNγ and promote inflammation by facilitating the accumulation of activated lymphocytes(59,60). Inhibition of LSD1 also enhances a coordinated network of IFNγ, CXCL9, and CXCR3, which are essential for T-cell infiltration and the induction of antitumor immunity. Within the tumor microenvironment (TME), these chemokines contribute to the establishment of a "hot" TME by initiating a chemokine network(61).
Furthermore, our study demonstrated that LSD1 inhibition promotes the expansion of IFNγ expressing T cells. The IFNγ-inducible chemokine CXCL9, produced by cells, recruits CXCR3-expressing CD8+ T cells from the circulation into the tumor microenvironment (62,63), potentially leading to a T cell-inflamed (hot) tumor microenvironment(50). Recent research has shown that CD4+, CD8+, and dendritic cells (DCs) function synergistically to enhance antitumor immunity (5), which aligns with our finding that LSD1 inhibition increases CXCL9 expression in DCs, CD4+, and CD8+ cells. Newly recruited CXCR3+ T cells produce IFNγ upon antigen engagement, further stimulating CXCL9 production by DCs and promoting increased T cell infiltration. Additionally, our findings indicate that the blockade of DCs in a co-culture system, results in decreased proliferation of CD8+ T cells. This data suggests that LSD1 inhibition enhances DC-mediated T cell proliferation and increases the expression of the DC-specific marker Batf3, a transcription factor essential for the development of cDC1s, which is linked to the production of CXCL9 and CXCL10 in the tumor microenvironment (TME) (64). Overall, this data identifies LSD1 as a key player in promoting DCs through the coordinated IFNγ-CXCL9-CXCR3 network, thereby activating CD8+ T cells to induce antitumor immunity.
We also found that Kdm1a expression was significantly inversely correlated with T cell-related genes (CD4, CD8, and CD3), DC-related genes (CXCL9 and XCR1), CD8+ cell activation markers (CXCR3), and T cell-induced factors (IFN-γ), whereas Kdm1a inhibition increased their expression in functional studies on syngeneic, chronic tobacco carcinogens, and humanized HNSCC stem cell models.
Although this is the first study to evaluate the role of LSD1 in DC-mediated antitumor immunity, few studies have investigated its underlying mechanisms. The stimulation of tumor suppressors or attenuation of oncogenic proteins can induce antitumor immunity, which includes activation of the P53 (65) melanocortin-1 receptor (MC1R) (66) EZH2 mediated suppression (67) trans-vaccenic acid diet (68), and LSD1 inhibition to promote endogenous retrovirus expression (69).
We showed that LSD1 inhibition reprogrammed HNSCC cells to upregulate mouse MHC-I molecules, as well as human MHC-I. Loss or downregulation of MHC-I in cancer cells is a major mechanism underlying resistance to T cell-based immunotherapies. These have been shown in studies of TRAF3 inhibition (70), chemoresistance, and immunotherapy resistance mechanisms (70) and with Histone methyltransferase WHSC1 (71). plays a role in this context. H3K4me2 marks regions near active genes (72)(Bernstein et al., 2005)(Bernstein et al., 2005)(73)(73)(73)(73)(72)(72). Our study offers new insights into the impact of LSD1 inhibition on the promotion of MHC-I, Cxcl9, and Cxcr3 through the enrichment of H3K4me2 and direct interaction with these genes. Collectively, these findings may have significant implications for the development of novel cancer immunotherapies.
In conclusion, we demonstrated for the first time that the inhibition of LSD1 enhances the ability of antigen-presenting DCs to activate CD8+ T cells, thereby inducing antitumor immunity. Additionally, we observed that LSD1 inhibition promotes the IFNγ-CXCL9-CXCR3 axis, facilitating the activation of DCs and the upregulation of MHC-I in HNSCC tumor cells. Our findings indicate that LSD1 inhibition significantly enhances antigen presentation. Furthermore, we identified a novel mechanism by which LSD1 inhibition triggers the activation of H3K4me2 and its direct interaction with MHC-I, Cxcl9, Cxcr3, and Batf3. These LSD1-mediated mechanisms may have implications for epigenetic therapy, addressing resistance in HNSCC treatments, and improving responses in poorly immunogenic tumors.
Supplementary Material
Statement of Significance:
LSD1 inhibition enhances antigen presentation and reprograms the tumor microenvironment by inducing infiltration of T cells and dendritic cells, activating antitumor immunity and providing an epigenetic therapy for head and neck cancer.
Acknowledgments
Support: This study was supported by NIH grants R01 DE031413 (MB), R01 DE030350 (MAK, SM, and XV), R01 DE033519 (XV, SM, and MAK), R01 DE030350 S1 (SM), R01 DE 031831 (SM) and CTSA pilot grant UL1TR001430 (MB). We are thankful to NIH tetramer core facility, Emory University for providing us the reagents useful for OVA tetramer assay. We are also thankful to the Flow Cytometry Core Facility of Boston University and the Microarray Core Facility of Boston University.
Footnotes
Competing interests: The authors declare no conflicts of interest regarding the content of this manuscript.
Financial Interests and Disclosures: All authors declare that they have no financial interests regarding the content of this manuscript.
Data Availability Statement:
Data generated in this study are publicly available in Gene Expression Omnibus (GEO) at GSE278349 (Bulk RNA-seq) and GSE278293 (scRNA-seq). The TCGA-HNSC data analyzed in this study is publicly available at https://portal.gdc.cancer.gov/projects/TCGA-HNSC. All other raw data generated in this study are available upon request from the corresponding author.
References:
- 1.Alsaqer SF, Tashkandi MM, Kartha VK, Yang YT, Alkheriji Y, Salama A, et al. Inhibition of LSD1 epigenetically attenuates oral cancer growth and metastasis. Oncotarget 2017;8:73372–86 [DOI] [PMC free article] [PubMed] [Google Scholar]
- 2.Chakraborty AK, Raut RD, Iqbal K, Choudhury C, Alhousami T, Chogle S, et al. Lysine-specific demethylase 1 controls key OSCC preneoplasia inducer STAT3 through CDK7 phosphorylation during oncogenic progression and immunosuppression. Int J Oral Sci 2025;17:31. [DOI] [PMC free article] [PubMed] [Google Scholar]
- 3.Alhousami T, Diny M, Ali F, Shin J, Kumar G, Kumar V, et al. Inhibition of LSD1 Attenuates Oral Cancer Development and Promotes Therapeutic Efficacy of Immune Checkpoint Blockade and YAP/TAZ Inhibition. Mol Cancer Res 2022;20:712–21 [DOI] [PMC free article] [PubMed] [Google Scholar]
- 4.Liu Y, Debo B, Li M, Shi Z, Sheng W, Shi Y. LSD1 inhibition sustains T cell invigoration with a durable response to PD-1 blockade. Nat Commun 2021;12:6831. [DOI] [PMC free article] [PubMed] [Google Scholar]
- 5.Espinosa-Carrasco G, Chiu E, Scrivo A, Zumbo P, Dave A, Betel D, et al. Intratumoral immune triads are required for immunotherapy-mediated elimination of solid tumors. Cancer Cell 2024;42:1202–16 e8 [DOI] [PMC free article] [PubMed] [Google Scholar]
- 6.Martinez-Gamero C, Malla S, Aguilo F. LSD1: Expanding Functions in Stem Cells and Differentiation. Cells 2021;10 [DOI] [PMC free article] [PubMed] [Google Scholar]
- 7.Macheleidt IF, Dalvi PS, Lim SY, Meemboor S, Meder L, Kasgen O, et al. Preclinical studies reveal that LSD1 inhibition results in tumor growth arrest in lung adenocarcinoma independently of driver mutations. Mol Oncol 2018;12:1965–79 [DOI] [PMC free article] [PubMed] [Google Scholar]
- 8.Mamun MAA, Zhang Y, Zhao JY, Shen DD, Guo T, Zheng YC, et al. LSD1: an emerging face in altering the tumor microenvironment and enhancing immune checkpoint therapy. J Biomed Sci 2023;30:60. [DOI] [PMC free article] [PubMed] [Google Scholar]
- 9.Dudziak D, Kamphorst AO, Heidkamp GF, Buchholz VR, Trumpfheller C, Yamazaki S, et al. Differential antigen processing by dendritic cell subsets in vivo. Science 2007;315:107–11 [DOI] [PubMed] [Google Scholar]
- 10.Binnewies M, Mujal AM, Pollack JL, Combes AJ, Hardison EA, Barry KC, et al. Unleashing Type-2 Dendritic Cells to Drive Protective Antitumor CD4(+) T Cell Immunity. Cell 2019;177:556–71 e16 [DOI] [PMC free article] [PubMed] [Google Scholar]
- 11.Cancel JC, Crozat K, Dalod M, Mattiuz R. Are Conventional Type 1 Dendritic Cells Critical for Protective Antitumor Immunity and How? Front Immunol 2019;10:9. [DOI] [PMC free article] [PubMed] [Google Scholar]
- 12.Lopez L, Morosi LG, La Terza F, Bourdely P, Rospo G, Amadio R, et al. Dendritic cell-targeted therapy expands CD8 T cell responses to bona-fide neoantigens in lung tumors. Nat Commun 2024;15:2280. [DOI] [PMC free article] [PubMed] [Google Scholar]
- 13.Borst J, Ahrends T, Babala N, Melief CJM, Kastenmuller W. CD4(+) T cell help in cancer immunology and immunotherapy. Nat Rev Immunol 2018;18:635–47 [DOI] [PubMed] [Google Scholar]
- 14.Ferris ST, Durai V, Wu R, Theisen DJ, Ward JP, Bern MD, et al. cDC1 prime and are licensed by CD4(+) T cells to induce anti-tumour immunity. Nature 2020;584:624–9 [DOI] [PMC free article] [PubMed] [Google Scholar]
- 15.Salmon H, Idoyaga J, Rahman A, Leboeuf M, Remark R, Jordan S, et al. Expansion and Activation of CD103(+) Dendritic Cell Progenitors at the Tumor Site Enhances Tumor Responses to Therapeutic PD-L1 and BRAF Inhibition. Immunity 2016;44:924–38 [DOI] [PMC free article] [PubMed] [Google Scholar]
- 16.Broz ML, Binnewies M, Boldajipour B, Nelson AE, Pollack JL, Erle DJ, et al. Dissecting the tumor myeloid compartment reveals rare activating antigen-presenting cells critical for T cell immunity. Cancer Cell 2014;26:638–52 [DOI] [PMC free article] [PubMed] [Google Scholar]
- 17.Hoekstra ME, Bornes L, Dijkgraaf FE, Philips D, Pardieck IN, Toebes M, et al. Long-distance modulation of bystander tumor cells by CD8(+) T cell-secreted IFNgamma. Nat Cancer 2020;1:291–301 [DOI] [PMC free article] [PubMed] [Google Scholar]
- 18.Tokunaga R, Zhang W, Naseem M, Puccini A, Berger MD, Soni S, et al. CXCL9, CXCL10, CXCL11/CXCR3 axis for immune activation - A target for novel cancer therapy. Cancer Treat Rev 2018;63:40–7 [DOI] [PMC free article] [PubMed] [Google Scholar]
- 19.Alspach E, Lussier DM, Miceli AP, Kizhvatov I, DuPage M, Luoma AM, et al. MHC-II neoantigens shape tumour immunity and response to immunotherapy. Nature 2019;574:696–701 [DOI] [PMC free article] [PubMed] [Google Scholar]
- 20.Ott PA, Hu Z, Keskin DB, Shukla SA, Sun J, Bozym DJ, et al. An immunogenic personal neoantigen vaccine for patients with melanoma. Nature 2017;547:217–21 [DOI] [PMC free article] [PubMed] [Google Scholar]
- 21.Meraz IM, Majidi M, Meng F, Shao R, Ha MJ, Neri S, et al. An Improved Patient-Derived Xenograft Humanized Mouse Model for Evaluation of Lung Cancer Immune Responses. Cancer Immunol Res 2019;7:1267–79 [DOI] [PMC free article] [PubMed] [Google Scholar]
- 22.Wang M, Yao LC, Cheng M, Cai D, Martinek J, Pan CX, et al. Humanized mice in studying efficacy and mechanisms of PD-1-targeted cancer immunotherapy. FASEB J 2018;32:1537–49 [DOI] [PMC free article] [PubMed] [Google Scholar]
- 23.Capasso A, Lang J, Pitts TM, Jordan KR, Lieu CH, Davis SL, et al. Characterization of immune responses to anti-PD-1 mono and combination immunotherapy in hematopoietic humanized mice implanted with tumor xenografts. J Immunother Cancer 2019;7:37. [DOI] [PMC free article] [PubMed] [Google Scholar]
- 24.Tang XH, Osei-Sarfo K, Urvalek AM, Zhang T, Scognamiglio T, Gudas LJ. Combination of bexarotene and the retinoid CD1530 reduces murine oral-cavity carcinogenesis induced by the carcinogen 4-nitroquinoline 1-oxide. Proceedings of the National Academy of Sciences of the United States of America 2014;111:8907–12 [DOI] [PMC free article] [PubMed] [Google Scholar]
- 25.Wang Z, Wu VH, Allevato MM, Gilardi M, He Y, Luis Callejas-Valera J, et al. Syngeneic animal models of tobacco-associated oral cancer reveal the activity of in situ anti-CTLA-4. Nat Commun 2019;10:5546. [DOI] [PMC free article] [PubMed] [Google Scholar]
- 26.Bais MV, Kukuruzinska M, Trackman PC. Orthotopic non-metastatic and metastatic oral cancer mouse models. Oral Oncol 2015;51:476–82 [DOI] [PMC free article] [PubMed] [Google Scholar]
- 27.Hiemer SE, Zhang L, Kartha VK, Packer TS, Almershed M, Noonan V, et al. A YAP/TAZ-Regulated Molecular Signature Is Associated with Oral Squamous Cell Carcinoma. Molecular cancer research : MCR 2015;13:957–68 [DOI] [PMC free article] [PubMed] [Google Scholar]
- 28.Kerenyi MA, Shao Z, Hsu YJ, Guo G, Luc S, O'Brien K, et al. Histone demethylase Lsd1 represses hematopoietic stem and progenitor cell signatures during blood cell maturation. Elife 2013;2:e00633. [DOI] [PMC free article] [PubMed] [Google Scholar]
- 29.Caulin C, Nguyen T, Longley MA, Zhou Z, Wang XJ, Roop DR. Inducible activation of oncogenic K-ras results in tumor formation in the oral cavity. Cancer research 2004;64:5054–8 [DOI] [PubMed] [Google Scholar]
- 30.Roberts EW, Broz ML, Binnewies M, Headley MB, Nelson AE, Wolf DM, et al. Critical Role for CD103(+)/CD141(+) Dendritic Cells Bearing CCR7 for Tumor Antigen Trafficking and Priming of T Cell Immunity in Melanoma. Cancer Cell 2016;30:324–36 [DOI] [PMC free article] [PubMed] [Google Scholar]
- 31.Morrissey MA, Williamson AP, Steinbach AM, Roberts EW, Kern N, Headley MB, et al. Chimeric antigen receptors that trigger phagocytosis. Elife 2018;7. [DOI] [PMC free article] [PubMed] [Google Scholar]
- 32.Crittenden MR, Zebertavage L, Kramer G, Bambina S, Friedman D, Troesch V, et al. Tumor cure by radiation therapy and checkpoint inhibitors depends on pre-existing immunity. Sci Rep 2018;8:7012. [DOI] [PMC free article] [PubMed] [Google Scholar]
- 33.Hong R, Koga Y, Bandyadka S, Leshchyk A, Wang Y, Akavoor V, et al. Comprehensive generation, visualization, and reporting of quality control metrics for single-cell RNA sequencing data. Nat Commun 2022;13:1688. [DOI] [PMC free article] [PubMed] [Google Scholar]
- 34.Hao Y, Stuart T, Kowalski MH, Choudhary S, Hoffman P, Hartman A, et al. Dictionary learning for integrative, multimodal and scalable single-cell analysis. Nat Biotechnol 2024;42:293–304 [DOI] [PMC free article] [PubMed] [Google Scholar]
- 35.Yang S, Corbett SE, Koga Y, Wang Z, Johnson WE, Yajima M, et al. Decontamination of ambient RNA in single-cell RNA-seq with DecontX. Genome Biol 2020;21:57. [DOI] [PMC free article] [PubMed] [Google Scholar]
- 36.Germain PL, Lun A, Garcia Meixide C, Macnair W, Robinson MD. Doublet identification in single-cell sequencing data using scDblFinder. F1000Res 2021;10:979. [DOI] [PMC free article] [PubMed] [Google Scholar]
- 37.Aran D, Looney AP, Liu L, Wu E, Fong V, Hsu A, et al. Reference-based analysis of lung single-cell sequencing reveals a transitional profibrotic macrophage. Nat Immunol 2019;20:163–72 [DOI] [PMC free article] [PubMed] [Google Scholar]
- 38.Heng TS, Painter MW, Immunological Genome Project C. The Immunological Genome Project: networks of gene expression in immune cells. Nat Immunol 2008;9:1091–4 [DOI] [PubMed] [Google Scholar]
- 39.Jin S, Guerrero-Juarez CF, Zhang L, Chang I, Ramos R, Kuan CH, et al. Inference and analysis of cell-cell communication using CellChat. Nat Commun 2021;12:1088. [DOI] [PMC free article] [PubMed] [Google Scholar]
- 40.Tashkandi MM, Alsaqer SF, Alhousami T, Ali F, Wu YC, Shin J, et al. LOXL2 promotes aggrecan and gender-specific anabolic differences to TMJ cartilage. Sci Rep 2020;10:20179. [DOI] [PMC free article] [PubMed] [Google Scholar]
- 41.Xu J, Xu X, Wang B, Ma Y, Zhang L, Xu H, et al. Nuclear carbonic anhydrase 6B associates with PRMT5 to epigenetically promote IL-12 expression in innate response. Proc Natl Acad Sci U S A 2017;114:8620–5 [DOI] [PMC free article] [PubMed] [Google Scholar]
- 42.Huang Y, Xu Z, Xiong S, Sun F, Qin G, Hu G, et al. Repopulated microglia are solely derived from the proliferation of residual microglia after acute depletion. Nat Neurosci 2018;21:530–40 [DOI] [PubMed] [Google Scholar]
- 43.Li T, Fu J, Zeng Z, Cohen D, Li J, Chen Q, et al. TIMER2.0 for analysis of tumor-infiltrating immune cells. Nucleic Acids Res 2020;48:W509–W14 [DOI] [PMC free article] [PubMed] [Google Scholar]
- 44.Shao Z, Wang K, Zhang S, Yuan J, Liao X, Wu C, et al. Ingenuity pathway analysis of differentially expressed genes involved in signaling pathways and molecular networks in RhoE gene-edited cardiomyocytes. Int J Mol Med 2020;46:1225–38 [DOI] [PMC free article] [PubMed] [Google Scholar]
- 45.Suthar SK, Lee SY. Ingenuity pathway analysis of alpha-synuclein predicts potential signaling pathways, network molecules, biological functions, and its role in neurological diseases. Front Mol Neurosci 2022;15:1029682. [DOI] [PMC free article] [PubMed] [Google Scholar]
- 46.Kansy BA, Concha-Benavente F, Srivastava RM, Jie HB, Shayan G, Lei Y, et al. PD-1 Status in CD8(+) T Cells Associates with Survival and Anti-PD-1 Therapeutic Outcomes in Head and Neck Cancer. Cancer Res 2017;77:6353–64 [DOI] [PMC free article] [PubMed] [Google Scholar]
- 47.Hildner K, Edelson BT, Purtha WE, Diamond M, Matsushita H, Kohyama M, et al. Batf3 deficiency reveals a critical role for CD8alpha+ dendritic cells in cytotoxic T cell immunity. Science 2008;322:1097–100 [DOI] [PMC free article] [PubMed] [Google Scholar]
- 48.Jin P, Han TH, Ren J, Saunders S, Wang E, Marincola FM, et al. Molecular signatures of maturing dendritic cells: implications for testing the quality of dendritic cell therapies. J Transl Med 2010;8:4. [DOI] [PMC free article] [PubMed] [Google Scholar]
- 49.Nelson CE, Thompson EA, Quarnstrom CF, Fraser KA, Seelig DM, Bhela S, et al. Robust Iterative Stimulation with Self-Antigens Overcomes CD8(+) T Cell Tolerance to Self- and Tumor Antigens. Cell Rep 2019;28:3092–104 e5 [DOI] [PMC free article] [PubMed] [Google Scholar]
- 50.House IG, Savas P, Lai J, Chen AXY, Oliver AJ, Teo ZL, et al. Macrophage-Derived CXCL9 and CXCL10 Are Required for Antitumor Immune Responses Following Immune Checkpoint Blockade. Clin Cancer Res 2020;26:487–504 [DOI] [PubMed] [Google Scholar]
- 51.Mikucki ME, Fisher DT, Matsuzaki J, Skitzki JJ, Gaulin NB, Muhitch JB, et al. Non-redundant requirement for CXCR3 signalling during tumoricidal T-cell trafficking across tumour vascular checkpoints. Nat Commun 2015;6:7458. [DOI] [PMC free article] [PubMed] [Google Scholar]
- 52.Senanayaka D, Zeng D, Alishiri S, Martin WJ, Moore KI, Patel R, et al. Autoregulatory mechanism of enzyme activity by the nuclear localization signal of lysine-specific demethylase 1. J Biol Chem 2024;300:107607. [DOI] [PMC free article] [PubMed] [Google Scholar]
- 53.Hiatt JB, Sandborg H, Garrison SM, Arnold HU, Liao SY, Norton JP, et al. Inhibition of LSD1 with Bomedemstat Sensitizes Small Cell Lung Cancer to Immune Checkpoint Blockade and T-Cell Killing. Clin Cancer Res 2022;28:4551–64 [DOI] [PMC free article] [PubMed] [Google Scholar]
- 54.Nguyen EM, Taniguchi H, Chan JM, Zhan YA, Chen X, Qiu J, et al. Targeting Lysine-Specific Demethylase 1 Rescues Major Histocompatibility Complex Class I Antigen Presentation and Overcomes Programmed Death-Ligand 1 Blockade Resistance in SCLC. J Thorac Oncol 2022;17:1014–31 [DOI] [PMC free article] [PubMed] [Google Scholar]
- 55.Szeto C, Lobos CA, Nguyen AT, Gras S. TCR Recognition of Peptide-MHC-I: Rule Makers and Breakers. Int J Mol Sci 2020;22 [DOI] [PMC free article] [PubMed] [Google Scholar]
- 56.Hennecke J, Wiley DC. T cell receptor-MHC interactions up close. Cell 2001;104:1–4 [DOI] [PubMed] [Google Scholar]
- 57.Garcia KC, Adams EJ. How the T cell receptor sees antigen--a structural view. Cell 2005;122:333–6 [DOI] [PubMed] [Google Scholar]
- 58.Ivashkiv LB. IFNgamma: signalling, epigenetics and roles in immunity, metabolism, disease and cancer immunotherapy. Nat Rev Immunol 2018;18:545–58 [DOI] [PMC free article] [PubMed] [Google Scholar]
- 59.Han JH, Suh CH, Jung JY, Ahn MH, Han MH, Kwon JE, et al. Elevated circulating levels of the interferon-gamma-induced chemokines are associated with disease activity and cutaneous manifestations in adult-onset Still's disease. Sci Rep 2017;7:46652. [DOI] [PMC free article] [PubMed] [Google Scholar]
- 60.Lee KS, Chung WY, Park JE, Jung YJ, Park JH, Sheen SS, et al. Interferon-gamma-Inducible Chemokines as Prognostic Markers for Lung Cancer. Int J Environ Res Public Health 2021;18 [DOI] [PMC free article] [PubMed] [Google Scholar]
- 61.Lv J, Ren J, Zheng J, Zhang F, Han M. Prognosis of Tumor Microenvironment in Luminal B-Type Breast Cancer. Dis Markers 2022;2022:5621441. [DOI] [PMC free article] [PubMed] [Google Scholar]
- 62.Spranger S, Dai D, Horton B, Gajewski TF. Tumor-Residing Batf3 Dendritic Cells Are Required for Effector T Cell Trafficking and Adoptive T Cell Therapy. Cancer Cell 2017;31:711–23 e4 [DOI] [PMC free article] [PubMed] [Google Scholar]
- 63.Cross-Najafi AA, Farag K, Isidan A, Li W, Zhang W, Lin Z, et al. Co-expression of HLA-E and HLA-G on genetically modified porcine endothelial cells attenuates human NK cell-mediated degranulation. Front Immunol 2023;14:1217809. [DOI] [PMC free article] [PubMed] [Google Scholar]
- 64.Hirai I, Funakoshi T, Kamijuku H, Fukuda K, Mori M, Sakurai M, et al. Adoptive cell therapy using tumor-infiltrating lymphocytes for melanoma refractory to immune-checkpoint inhibitors. Cancer Sci 2021;112:3163–72 [DOI] [PMC free article] [PubMed] [Google Scholar]
- 65.Zhou X, Singh M, Sanz Santos G, Guerlavais V, Carvajal LA, Aivado M, et al. Pharmacologic Activation of p53 Triggers Viral Mimicry Response Thereby Abolishing Tumor Immune Evasion and Promoting Antitumor Immunity. Cancer Discov 2021;11:3090–105 [DOI] [PMC free article] [PubMed] [Google Scholar]
- 66.Cui Y, Miao Y, Cao L, Guo L, Cui Y, Yan C, et al. Activation of melanocortin-1 receptor signaling in melanoma cells impairs T cell infiltration to dampen antitumor immunity. Nat Commun 2023;14:5740. [DOI] [PMC free article] [PubMed] [Google Scholar]
- 67.Hong J, Lee JH, Zhang Z, Wu Y, Yang M, Liao Y, et al. PRC2-Mediated Epigenetic Suppression of Type I IFN-STAT2 Signaling Impairs Antitumor Immunity in Luminal Breast Cancer. Cancer Res 2022;82:4624–40 [DOI] [PMC free article] [PubMed] [Google Scholar]
- 68.Fan H, Xia S, Xiang J, Li Y, Ross MO, Lim SA, et al. Trans-vaccenic acid reprograms CD8(+) T cells and anti-tumour immunity. Nature 2023;623:1034–43 [DOI] [PMC free article] [PubMed] [Google Scholar]
- 69.Sheng W, LaFleur MW, Nguyen TH, Chen S, Chakravarthy A, Conway JR, et al. LSD1 Ablation Stimulates Anti-tumor Immunity and Enables Checkpoint Blockade. Cell 2018;174:549–63 e19 [DOI] [PMC free article] [PubMed] [Google Scholar]
- 70.Gu SS, Zhang W, Wang X, Jiang P, Traugh N, Li Z, et al. Therapeutically Increasing MHC-I Expression Potentiates Immune Checkpoint Blockade. Cancer Discov 2021;11:1524–41 [DOI] [PMC free article] [PubMed] [Google Scholar]
- 71.Ren J, Li N, Pei S, Lian Y, Li L, Peng Y, et al. Histone methyltransferase WHSC1 loss dampens MHC-I antigen presentation pathway to impair IFN-gamma-stimulated antitumor immunity. J Clin Invest 2022;132 [DOI] [PMC free article] [PubMed] [Google Scholar]
- 72.Bernstein BE, Kamal M, Lindblad-Toh K, Bekiranov S, Bailey DK, Huebert DJ, et al. Genomic maps and comparative analysis of histone modifications in human and mouse. Cell 2005;120:169–81 [DOI] [PubMed] [Google Scholar]
Associated Data
This section collects any data citations, data availability statements, or supplementary materials included in this article.
Supplementary Materials
Data Availability Statement
Data generated in this study are publicly available in Gene Expression Omnibus (GEO) at GSE278349 (Bulk RNA-seq) and GSE278293 (scRNA-seq). The TCGA-HNSC data analyzed in this study is publicly available at https://portal.gdc.cancer.gov/projects/TCGA-HNSC. All other raw data generated in this study are available upon request from the corresponding author.