
Figure 1.
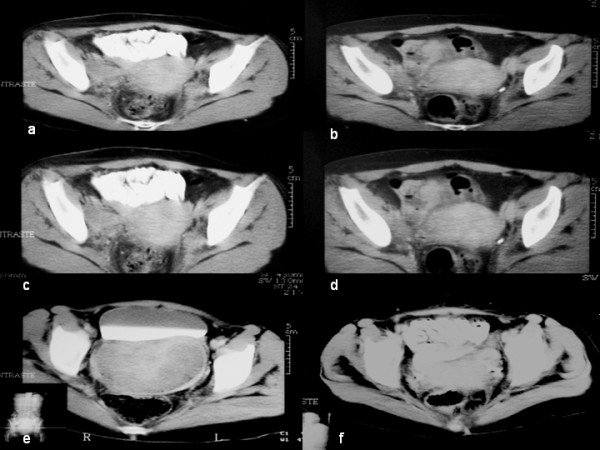
Patients with complete pathological response post-chemotherapy. CT scans of 3 patients showing residual pelvic mass after chemotherapy. Images a,c,e show CT scans pre-treatment, and images b,d,f are the post-treatment control studies. Notably, a patient (images e-f) shows a residual post-chemotherapy pelvic mass measuring 9 × 5 cm.