Figure 3.
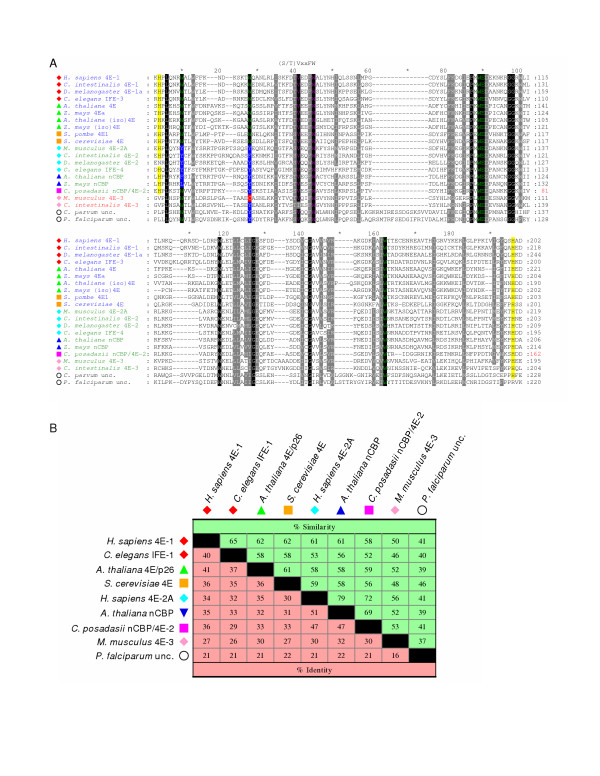
Comparison of the conserved cores of eIF4E-family members from different taxonomic sub-groups. A. An alignment of amino acid sequences representing the conserved core regions of the indicated eIF4E-family members. Sequence names are highlighted to indicate structural class: Class I in blue; Class II in green; and Class III in red. Atypical eIF4E-family members that could not be accurately classified based on similarity to other structural class members are shown with sequences names in black. Symbols to the left indicate the taxonomic sub-group of the eIF-4E-family member (as described in the legend to Figure 2). Residues highlighted within the amino acid alignment represent: identity with respect to residues Trp-43, Trp-56, Trp-102, Glu-103, and Trp-166 within H. sapiens eIF4E-1 (green); identity within the conserved (S/T)VxxFW consensus region containing amino acids equivalent to Val-69 and Trp-73 of H. sapiens eIF4E-1(purple); identity with His-residues equivalent to those that border the core region of H. sapiens eIF4E-1 (shaded in yellow). Variations at residues equivalent to Trp-43 and Trp-56 of H. sapiens eIF4E-1 are indicated as follows: Tyr/Phe-shaded in blue with white text; Cys-shaded in red with white text. Residues shaded in black or grey within the alignment indicate amino acids that are identical in all sequences or similar in greater than 85% of the sequences, respectively. Numbers to the right of the alignment represent distances of amino acids with respect to the predicted N-terminal Met residue. B. Identities and similarities (based on a PAM 250 matrix [58]) between the amino acid sequences representing the core regions of selected eIF4E-family members from each of the eight sub-groups.

