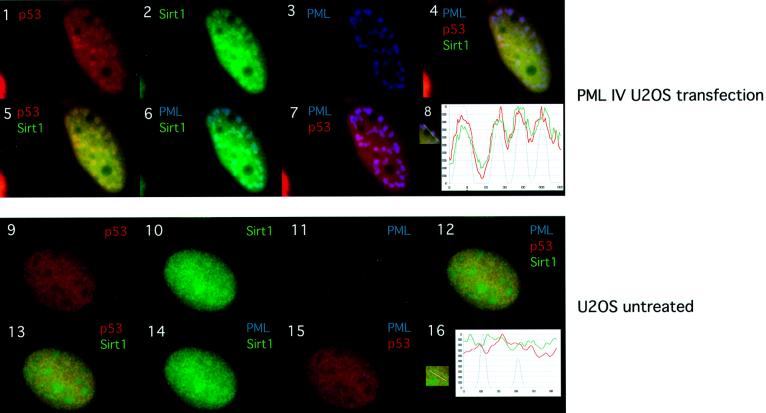
Fig. 3. PML, SIRT1 and p53 co-localize in the NBs. U20S cells were either transfected with pcDNA3-PML IV (panels 1–7) or un-treated (panels 9–15). PML staining with mouse monoclonal PGM3 is shown in blue (AMCA), endogenous p53 staining with goat polyclonal anti-p53 in red (Cy3) and endogenous SIRT1 staining with rabbit anti-sirt1 in green (Alexa 488). Co-localization is shown in yellow (p53 and SIRT1), light blue (PML and SIRT1), violet (PML and p53) and white (triple co-localization). Panels 8 and 16 show the normalized intensity profiles along the lines showed in the insert respectively: p53 (red line), SIRT1 (green line) and PML (blue line). Blue peaks identify PML accumulation in the NBs. Peak distribution in panel 8 supports triple co-localization of p53, SIRT1 and PML.

An official website of the United States government
Here's how you know
Official websites use .gov
A
.gov website belongs to an official
government organization in the United States.
Secure .gov websites use HTTPS
A lock (
) or https:// means you've safely
connected to the .gov website. Share sensitive
information only on official, secure websites.
