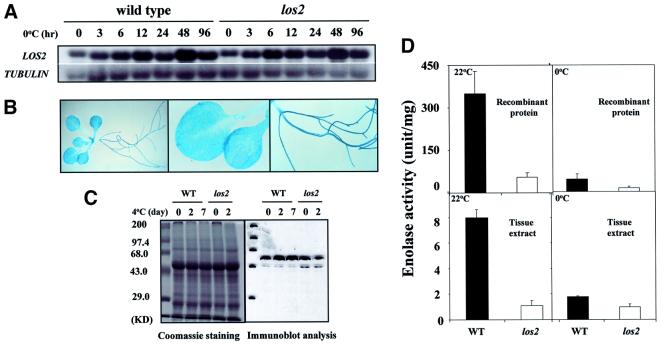
Fig. 7. Gene expression pattern and enolase activity of LOS2. (A) Expression of the LOS2 gene transcript. Full-length LOS2 cDNA was used as a probe. The β-tubulin gene was used as a loading control. (B) LOS2 promoter::GUS expression. Wild-type plants containing LOS2 promoter::GUS were stained with X-Gluc for 15 h and visualized under a microscope. (C) Immunoblot analysis. A 20 µg aliquot of total protein from wild-type and los2 leaves was extracted and fractionated in a 12.5% SDS–polyacrylamide gel. Shown are the gel picture of Coomassie staining and immunodetection with polyclonal anti-enolase. Molecular size markers are shown on the left. (D) Wild-type and mutant enolase activity. Shown are the mean values ± SE from three replicates.

An official website of the United States government
Here's how you know
Official websites use .gov
A
.gov website belongs to an official
government organization in the United States.
Secure .gov websites use HTTPS
A lock (
) or https:// means you've safely
connected to the .gov website. Share sensitive
information only on official, secure websites.
