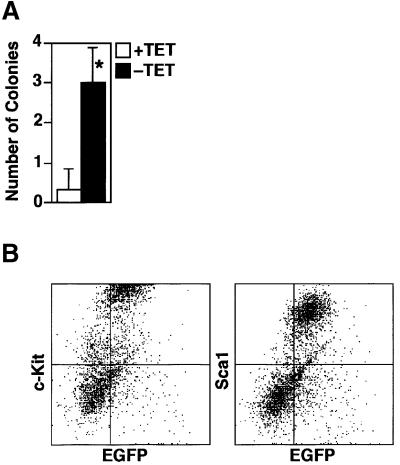
Fig. 3. Number of hematopoietic colonies at day 15 and surface marker profile of day 18 induced cells. (A) Hematopoietic colonies at day 15 of induction. Data are shown as the mean ± SD of six samples (*P < 0.01 by t-test). (B) c-Kit and Sca-1 expression on the cells persistent at day 18 of induction with the expression of GATA-2. The majority of EGFP-positive cells expressed c-Kit and Sca-1, markers of immature hematopoietic cells.

An official website of the United States government
Here's how you know
Official websites use .gov
A
.gov website belongs to an official
government organization in the United States.
Secure .gov websites use HTTPS
A lock (
) or https:// means you've safely
connected to the .gov website. Share sensitive
information only on official, secure websites.
