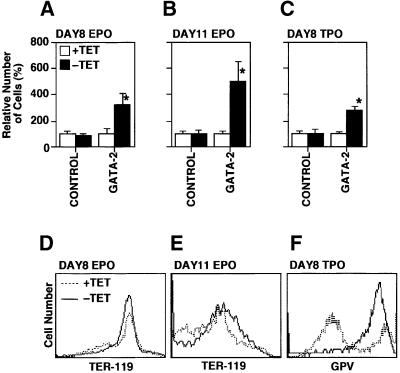
Fig. 4. Numbers and lineage marker profile of the cells induced from ES cells in the presence of EPO or TPO. (A–C) Numbers of cells at days 8 and 11 in the presence of EPO or TPO as described. GATA-2 expression increased the numbers of cell significantly (*P < 0.01 by t-test). Data are shown as the mean ± SD of six samples. (D–F) Surface expression of lineage markers TER-119 and platelet GPV.

An official website of the United States government
Here's how you know
Official websites use .gov
A
.gov website belongs to an official
government organization in the United States.
Secure .gov websites use HTTPS
A lock (
) or https:// means you've safely
connected to the .gov website. Share sensitive
information only on official, secure websites.
