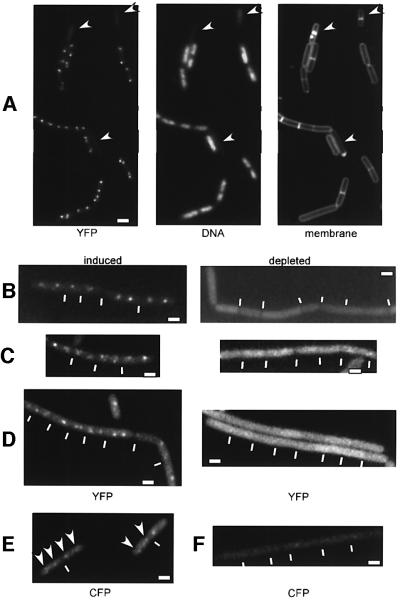
Fig. 4. Fluorescence microscopy of exponentially growing cells from strains (A) PG35 (scpB-yfp, spo0J::spec), (B) PG33 (scpB-yfp, pspac-smc at amy locus, smc::kan), (C) JM17 (scpA-yfp, pspac-smc at amy locus, smc::kan), (D) PG41 (scpA-yfp, scpB::tet, pxyl-scpB-cfp at amy locus), (E) JM10 (pxyl-scpB-cfp at amy locus) and (F) JM18 (scpA::tet, pxyl-scpB-cfp at amy locus) in the presence of xylose. Depleted indicates that the inducer was removed during exponential growth 3–5 h prior to image acquisition. Arrows indicate anucleate cells in (A) and ScpB–CFP foci in (E), and white lines indicate septa between cells. Images ‘induced’ and ‘depleted’, and (E) and (F) are scaled. White rectangles indicate 2 µm.

An official website of the United States government
Here's how you know
Official websites use .gov
A
.gov website belongs to an official
government organization in the United States.
Secure .gov websites use HTTPS
A lock (
) or https:// means you've safely
connected to the .gov website. Share sensitive
information only on official, secure websites.
