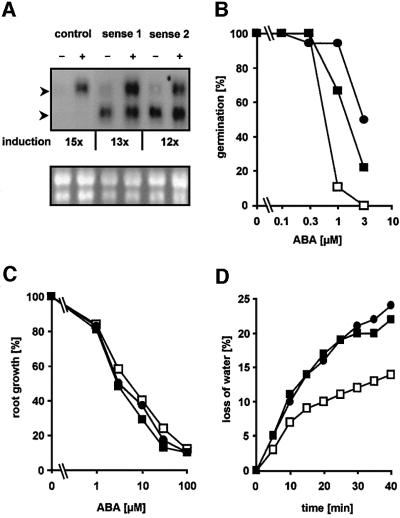
Fig. 6. Analysis of ABA responses in Arabidopsis plants with ectopic expression of ATHB6. (A) Northern blot analysis for ATHB6-specific RNA abundance in two transgenic Arabidopsis lines (sense 1 and sense 2) ectopically expressing ATHB6, and in control plants in which the ATHB6 structural gene had been replaced by the GUS coding sequence (control). Total RNA (20 µg) of seedlings treated with (+) or without (–) 10 µM ABA for 24 h was separated by electrophoresis and probed for the presence of ATHB6 transcripts (upper panel). The position of endogenous ATHB6 and ectopically expressed mRNA is indicated by the upper and lower arrowhead, respectively. The transcripts differ in size due to deletions in the untranslated leader sequences of the ATHB6 RNA constitutively expressed from the 35S promoter. The level of endogenous transcript induction by ABA is stated below and is corrected for equal RNA loading, which was determined by imaging and quantifying rRNA bands of the RNA samples stained with ethidium bromide (lower panel). (B) Fraction of seeds germinating in the presence of ABA after 5 days determined from a total of 80 seeds. (C) Five-day-old seedlings grown under sterile conditions were transferred on solid medium with various ABA concentrations. Root growth within 4 days of transfer was determined (n = 30, SD ± 14%). In the absence of ABA, root growth equalled 15 ± 1, 14 ± 2 and 14 ± 1 mm for the control, sense 1 and sense 2 lines, respectively. (D) Stomatal response measured by water loss of excised leaves. Leaves of a comparable developing stage (n = 5) from 4-week-old plants were excised and the loss of the fresh weight was measured at ambient conditions. The values are indicated for the control (open squares), as well as for the transgenic sense 1 (closed squares) and sense 2 (closed circles) lines.

An official website of the United States government
Here's how you know
Official websites use .gov
A
.gov website belongs to an official
government organization in the United States.
Secure .gov websites use HTTPS
A lock (
) or https:// means you've safely
connected to the .gov website. Share sensitive
information only on official, secure websites.
