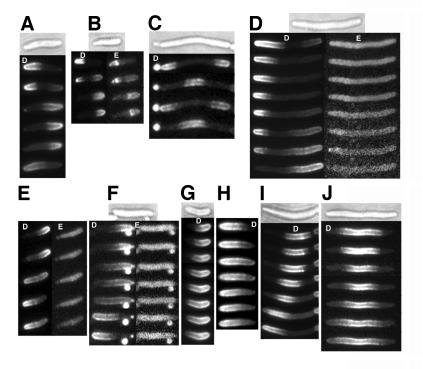
Fig. 6. Localization of YFP–MinD and MinE–CFP in living cells. Time-lapse fluorescence micrographs of strain RC1 containing: (A–C) pYLS68 (Plac-yfp::minD minE::cfp) or (D–J) pYLS77 (Plac-yfp::minD minED45A/V49A::cfp). White letters: D, YFP–MinD; E, MinE–CFP. Nomarski images are also shown. Time intervals between images were: (A–F) 1 min; (G) 2 min; (H) 1.5 min; (I) 1.75 min; (J) 1 min. In (B) and (D–F), MinE–CFP images (on the right) were acquired 10 s after the corresponding YFP–MinD images.

An official website of the United States government
Here's how you know
Official websites use .gov
A
.gov website belongs to an official
government organization in the United States.
Secure .gov websites use HTTPS
A lock (
) or https:// means you've safely
connected to the .gov website. Share sensitive
information only on official, secure websites.
