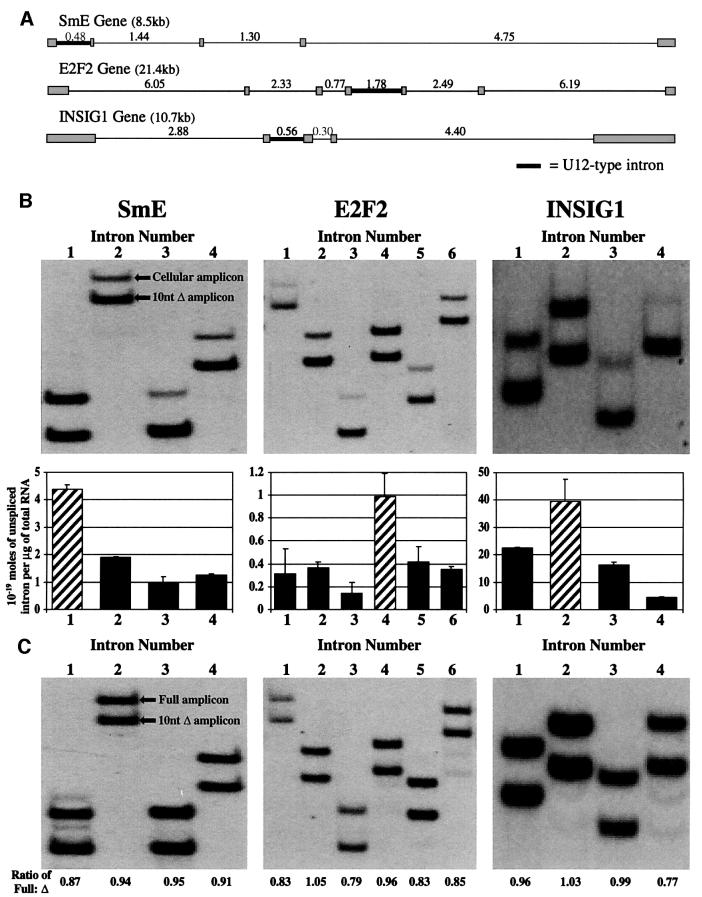
Fig. 2. U12-type introns are excised most slowly from three endogenous human pre-mRNAs. (A) The intron–exon structure is depicted for the three human genes, SmE, E2F2 and INSIG1. Shaded boxes represent exons, thin lines represent U2-type introns and thick lines represent U12-type introns, with intron lengths (in kb) indicated above. (B) Above are shown the gels from which the ratios of cellular to control amplicons (105–164 nt long with controls being 10 nt shorter) were measured. The amounts of each unspliced intron within the pre-mRNA population from growing HeLa cells (for SmE and E2F2) or SK Hep cells (for INSIG1) are shown graphically below. Solid bars represent U2-type introns and hatched bars represent U12-type introns, with error bars indicating the standard deviation of two experiments. 4.56 × 10⁻¹⁹ moles, 1.01 × 10⁻¹⁹ moles and 4.47 × 10⁻¹⁸ moles of control RNA standards were added per microgram of total cellular RNA for the analysis of introns from SmE, E2F2 and INSIG1, respectively. (C) Control co-amplification of equal amounts of in vitro-transcribed full-length and 10-nt truncated RNAs shows approximately equal production of amplicons (ratio of 0.91 ± 0.08). 10–19 moles of each RNA species were RT–PCR amplified.

An official website of the United States government
Here's how you know
Official websites use .gov
A
.gov website belongs to an official
government organization in the United States.
Secure .gov websites use HTTPS
A lock (
) or https:// means you've safely
connected to the .gov website. Share sensitive
information only on official, secure websites.
