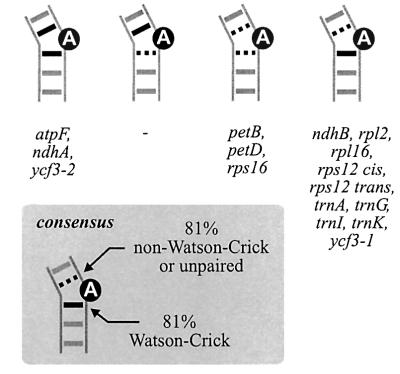
Fig. 5. Classification of all 16 lariat-forming group II introns of barley chloroplasts according to base pairs neighbouring the determined branch-site adenosine (black circle; cf. Figure 1). Watson–Crick pairs are represented by black thick lines. Dashed black lines represent wobble or non-pairing. A consensus structure drawn from this intron set suggests weak or non-pairing upstream, with concomitant tight Watson–Crick pairing downstream of the branch-site (lower left).

An official website of the United States government
Here's how you know
Official websites use .gov
A
.gov website belongs to an official
government organization in the United States.
Secure .gov websites use HTTPS
A lock (
) or https:// means you've safely
connected to the .gov website. Share sensitive
information only on official, secure websites.
