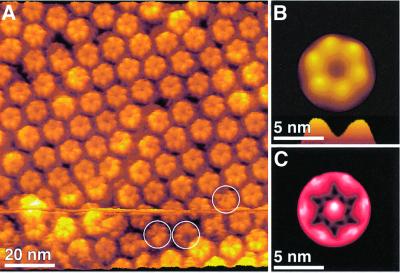
Fig. 3. Extracellular connexon surface recorded in a Ca2+-free buffer solution. (A) AFM topograph showing the connexon arrangement. Individual connexons exhibit defects of the size of single connexins as indicated by circles. (B) Average of the raw data shown in (A), exhibiting a lateral resolution of ∼1.2 nm. Connexin assembly of the connexon and the extracellular channel opening (profile at bottom) are clearly seen. (C) To access the flexibility of the structural details, a SD map of the average was calculated (Müller et al., 1998). The SD map had a range from 0.1 nm (black) to 0.4 nm (white), and is shown in black to red to white shades. The maximum SD value located at the connexon pore indicates an enhanced structural variability of this area. The topograph was recorded in buffer solution (5 mM Tris, 1 mM EGTA and 1 mM PMSF) at an applied force of 50 pN and a line frequency of 5.5 Hz, and has a vertical scale of 2 nm. All images were displayed as relief tilted by 5°.

An official website of the United States government
Here's how you know
Official websites use .gov
A
.gov website belongs to an official
government organization in the United States.
Secure .gov websites use HTTPS
A lock (
) or https:// means you've safely
connected to the .gov website. Share sensitive
information only on official, secure websites.
