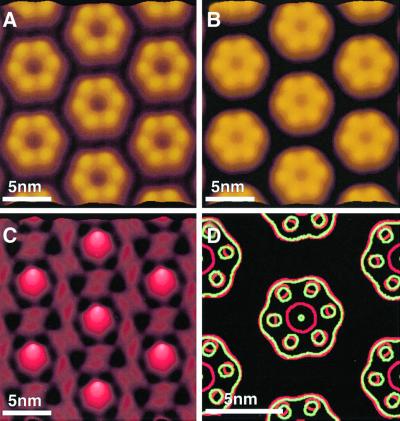
Fig. 5. Connexon surface as a function of Ca2+ concentration. Extracellular surfaces of connexons displayed in an idealized 2D lattice were recorded in the absence (A) and presence (B) of Ca2+. Correlation averages shown were calculated from several topographs recorded under equivalent conditions. The lateral resolution of the averages was limited to ∼1.5 nm. To visualize their differences, a difference map was calculated (C). (D) Superimposed contours of the two conformations (red, no Ca2+; green, with Ca2+). All presentations show that the most significant change is observed at the pore. The contour plots, however, show that in the presence of Ca2+ the connexin surface protrusions move towards the pore center. Note that the greatest difference is in the size of the pore. The images exhibiting a vertical gray level range of 2 nm (A and B) and 0.8 nm (C) were displayed as relief tilted by 5°.

An official website of the United States government
Here's how you know
Official websites use .gov
A
.gov website belongs to an official
government organization in the United States.
Secure .gov websites use HTTPS
A lock (
) or https:// means you've safely
connected to the .gov website. Share sensitive
information only on official, secure websites.
