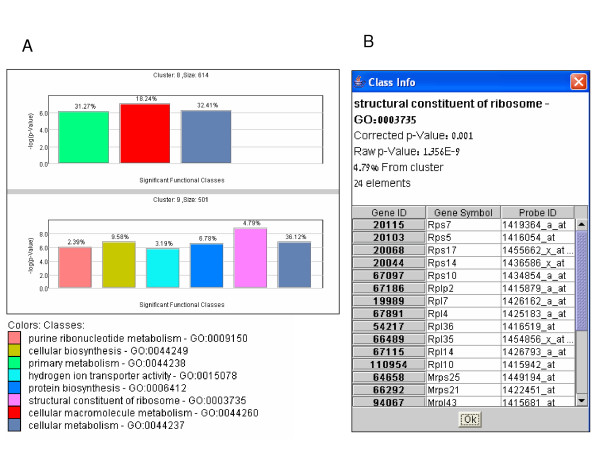
Figure 5.
GO functional enrichment analysis. (A) Enriched GO categories identified by TANGO in the analyzed gene groups (clusters or biclusters) are displayed as bar diagrams; each corresponding to a specific gene group (i. e., cluster or bicluster). In these diagrams, GO categories are color-coded, and the height of a bar represents the statistical significance (-log10(p-value)) of the observed enrichment for its corresponding category. The percentage of genes in the group assigned to the enriched category is indicated above the bar. (B) Clicking on a bar pops-up a window that lists the group's genes that are associated with the corresponding GO category. In this window, genes are linked to central annotation DBs (SGD [25] for yeast, WormBase [26] for worm, FlyBase [27] for fly, and Entrez Gene [28] for human, mouse and rat) where detailed gene descriptions can be found for in-depth analysis.

